Load Tests
To demonstrate the possible advantage of this PoC implementation in comparison to the Ruby implementation (cloud_controller_ng) we ran a few load tests to find out the limits of both implementations.
The aim of this was to get an idea how much performance a new implementation could potentially offer by comparing select endpoints that we had already fully implemented in the new implementation. The load test was conducted with vegeta and netdata to monitor VM and database resources.
Go vs Ruby implementation
We executed the same tests on both implementations on comparable hosting setups using the same database. The following features were implemented for this comparison:
- Logging
- Metrics (Prometheus)
- Rate Limiting (not enabled during tests)
- Authentication
- Authorization
The tests then ran the same API call against specific endpoints with a variable number of requests per second. These following endpoints where fully implemented in Go and compliant with CF V3 API 3.109.0:
Test setup
The database was seeded with entries to have realistic database processing times as well as realistic result sets returned by Postgres. We ran these tests on a DB with:
- 50 Spaces (ideally this number should have been higher but this was only noticed after the tests)
- 1000 Orgs
- 20 Buildpacks
- 40000 Security Groups
Other key setup facts:
- The test was conducted on AWS
- We used
cloud_controller_ngversion3.108.0and the Go implementation version0.0.19 - Both implementations were deployed as a single instance
- We executed these tests from a gorouter VM that had an instance type of
c4.8xlarge - We skipped the Cloud Foundry routing layer by accessing the instances under test directly over the private network the gorouter is also part of
- Both the Go and Ruby implementations of the CloudController were deployed on a
t3a.xlargeinstance - Postgres database used was intentionally oversized to a
db.m5.2xlargeinstance to prevent the DB being a bottleneck - The maximum amount of concurrently usable DB connections for both implementations was set to
500 - The
threadpool_sizeconfig parameter incloud_controller_ngwas set to1000to theoretically make the maximum possible parallelism more even between the implementations (although we know Ruby is single threaded) - The test was conducted with an admin user and rate limiting was not enabled on either implementation
/v3/info
The load test of the /v3/info endpoint was designed to indicate the maximum number of requests the web server for each implementation can handle, excluding expensive business logic, authentication or external systems (e.g. database). It represents the raw theoretical throughput the underlying technology stack can serve.
Ruby Implementation
For the Ruby implementation, whilst 64 requests per second on the v3/info endpoint ran without issues, the instance broke down at 128 requests per second.
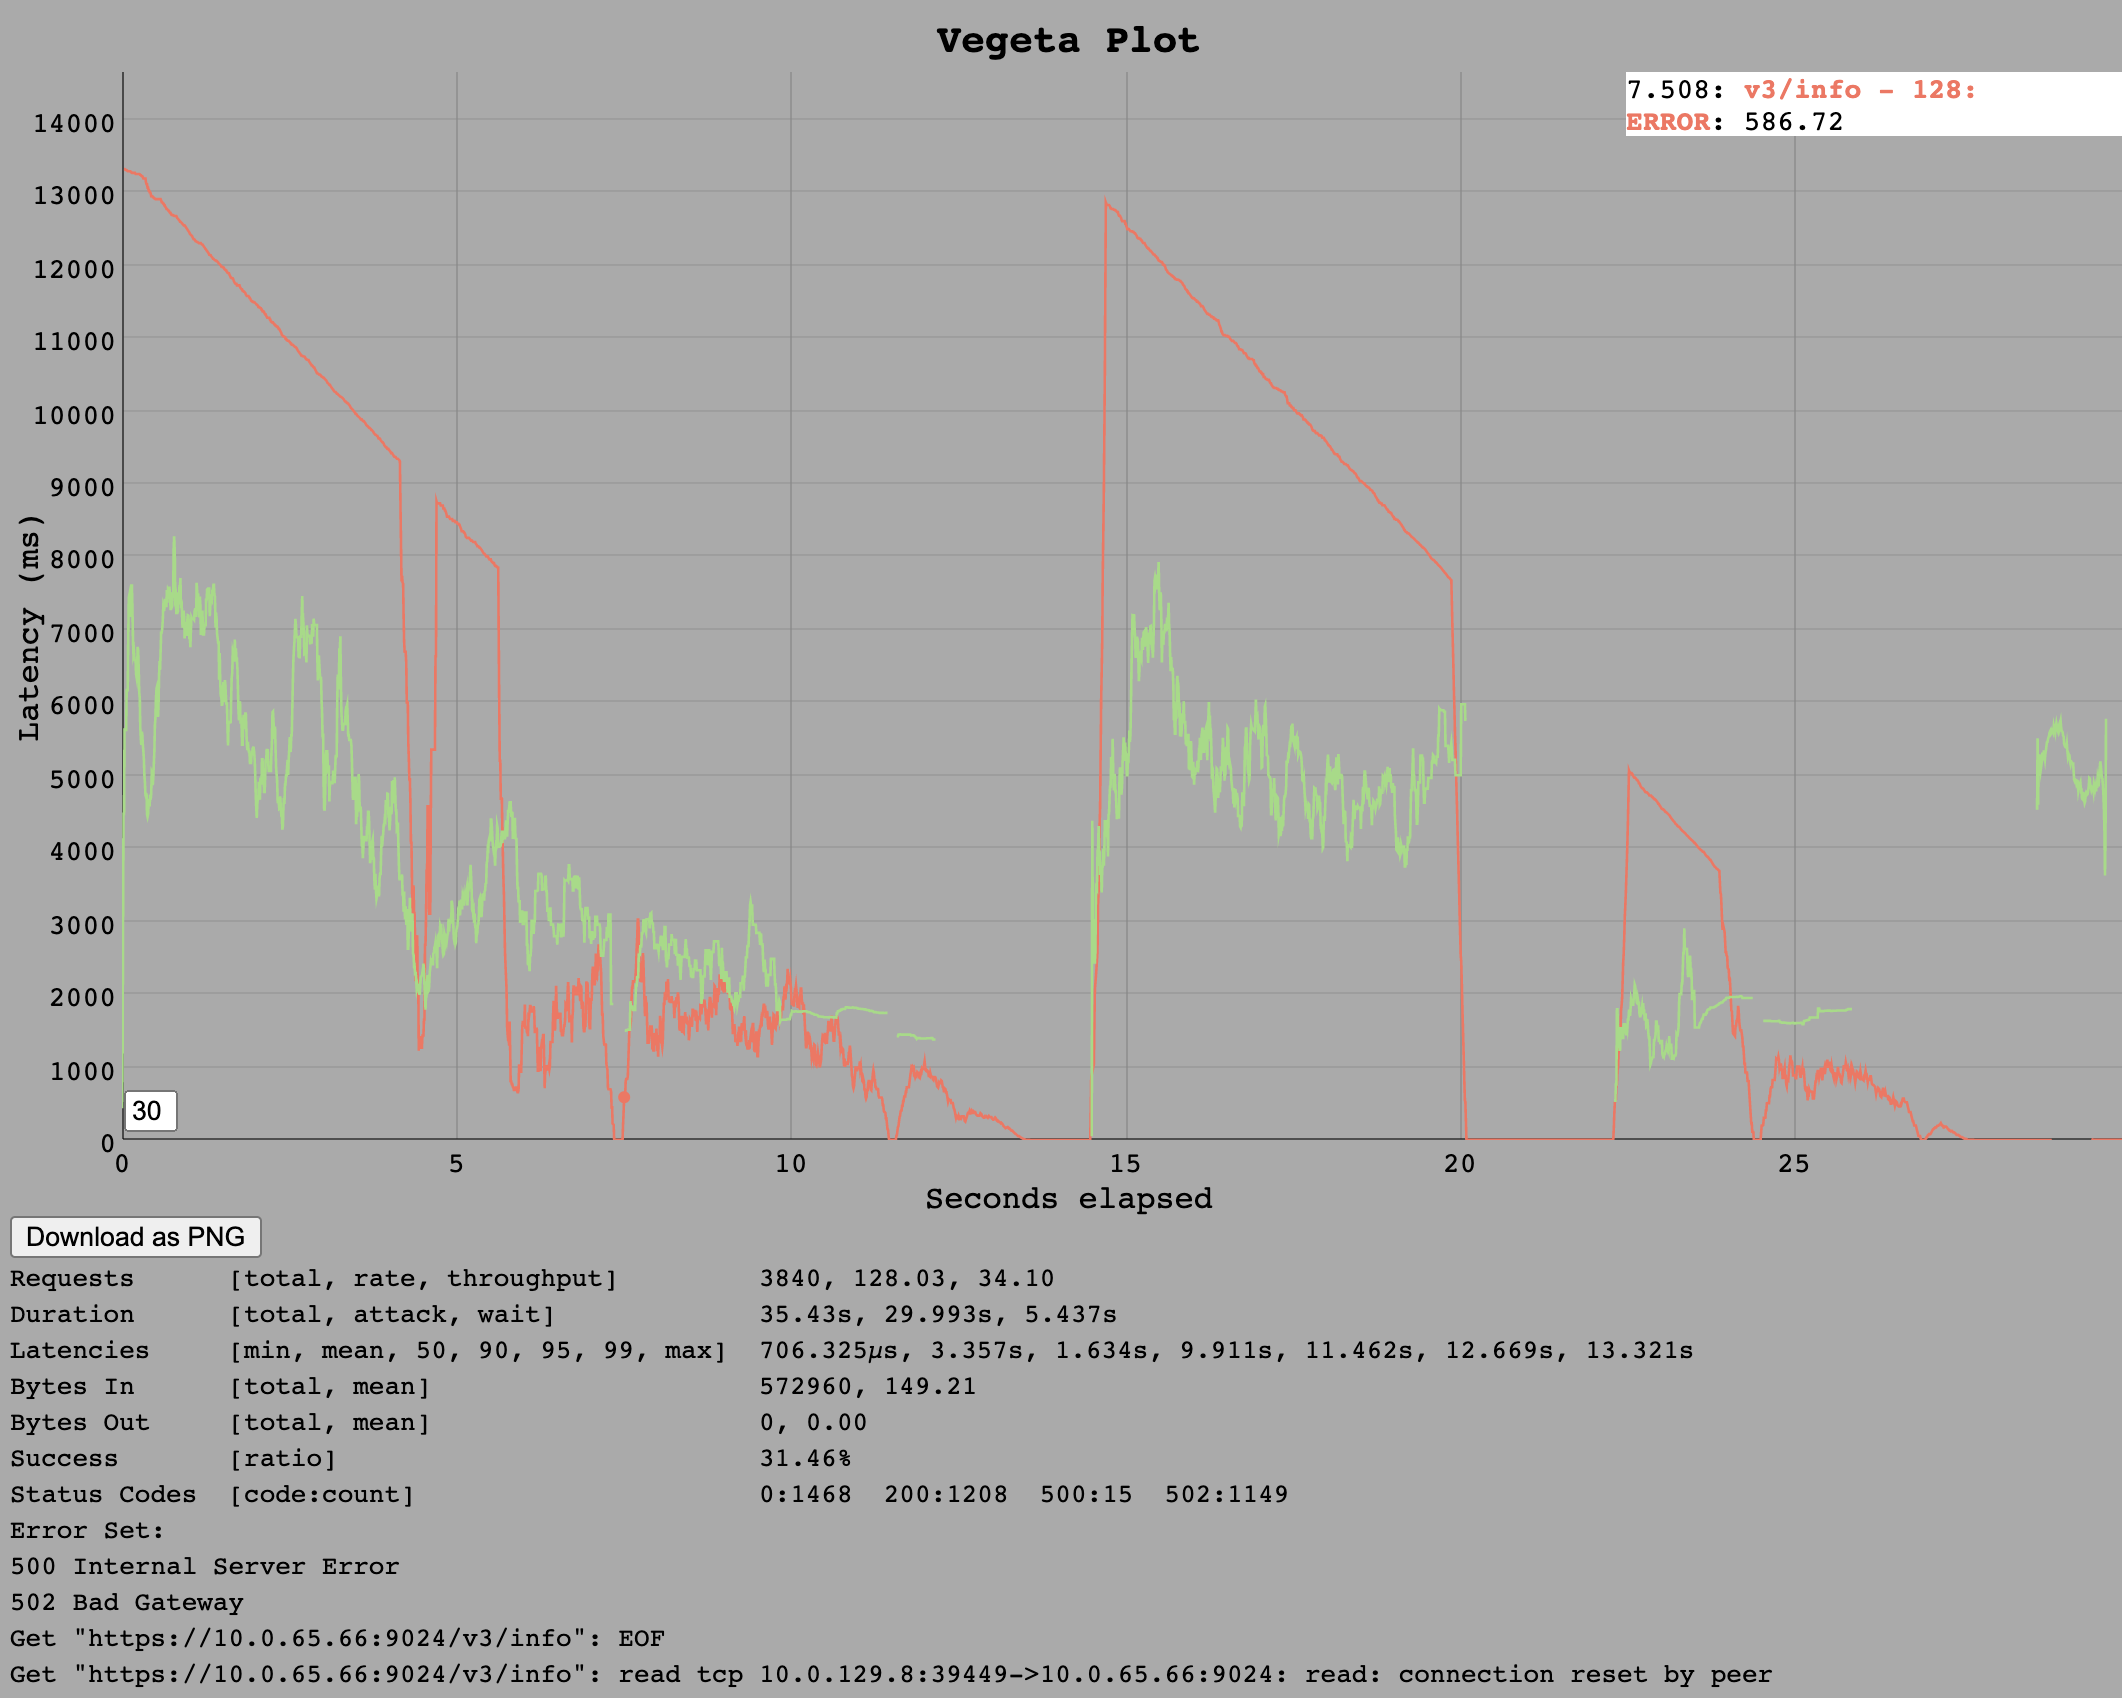 Interestingly, from the first second onward, we observed API error responses that were also slow (13 seconds). In addition, the time it takes for these errors to return decreases linearly until it matches the response times of successful calls.
Only 30% of the requests are served correctly, which is even lower then the previously achieved 64 requests per second.
The error codes are
 502 Bad Gatewaty so the behaviour we have previously observed in outages of cloud_controller_ng was reproduced in these tests. Most likely the cloud_controller_ng web process did not answer its own health endpoint (in time) and so nginx considered the backend unhealthy and a 502 was served. Interestingly enough we also see 500 Internal Server Error responses which should not happen as this means unhandled exceptions in the code.
Somewhere around 100 requests per second is the estimated hard limit of requests per second for any endpoint as /v3/info should be one of the least expensive.
In the VM Resources Section, at 128 requests per second, the API is not limited by system resources. However Cloud Controller Load shows a usage of 25% which means a full core. This is the expected hard limit of Ruby as the Ruby interpreter runs in a single thread.
Go Implementation
Initially it was thought that 4k requests per second would be more than the maximum for a 4 core VM so tests were only conducted up to this rate. The Go implementation appeared to be able to handle this load.
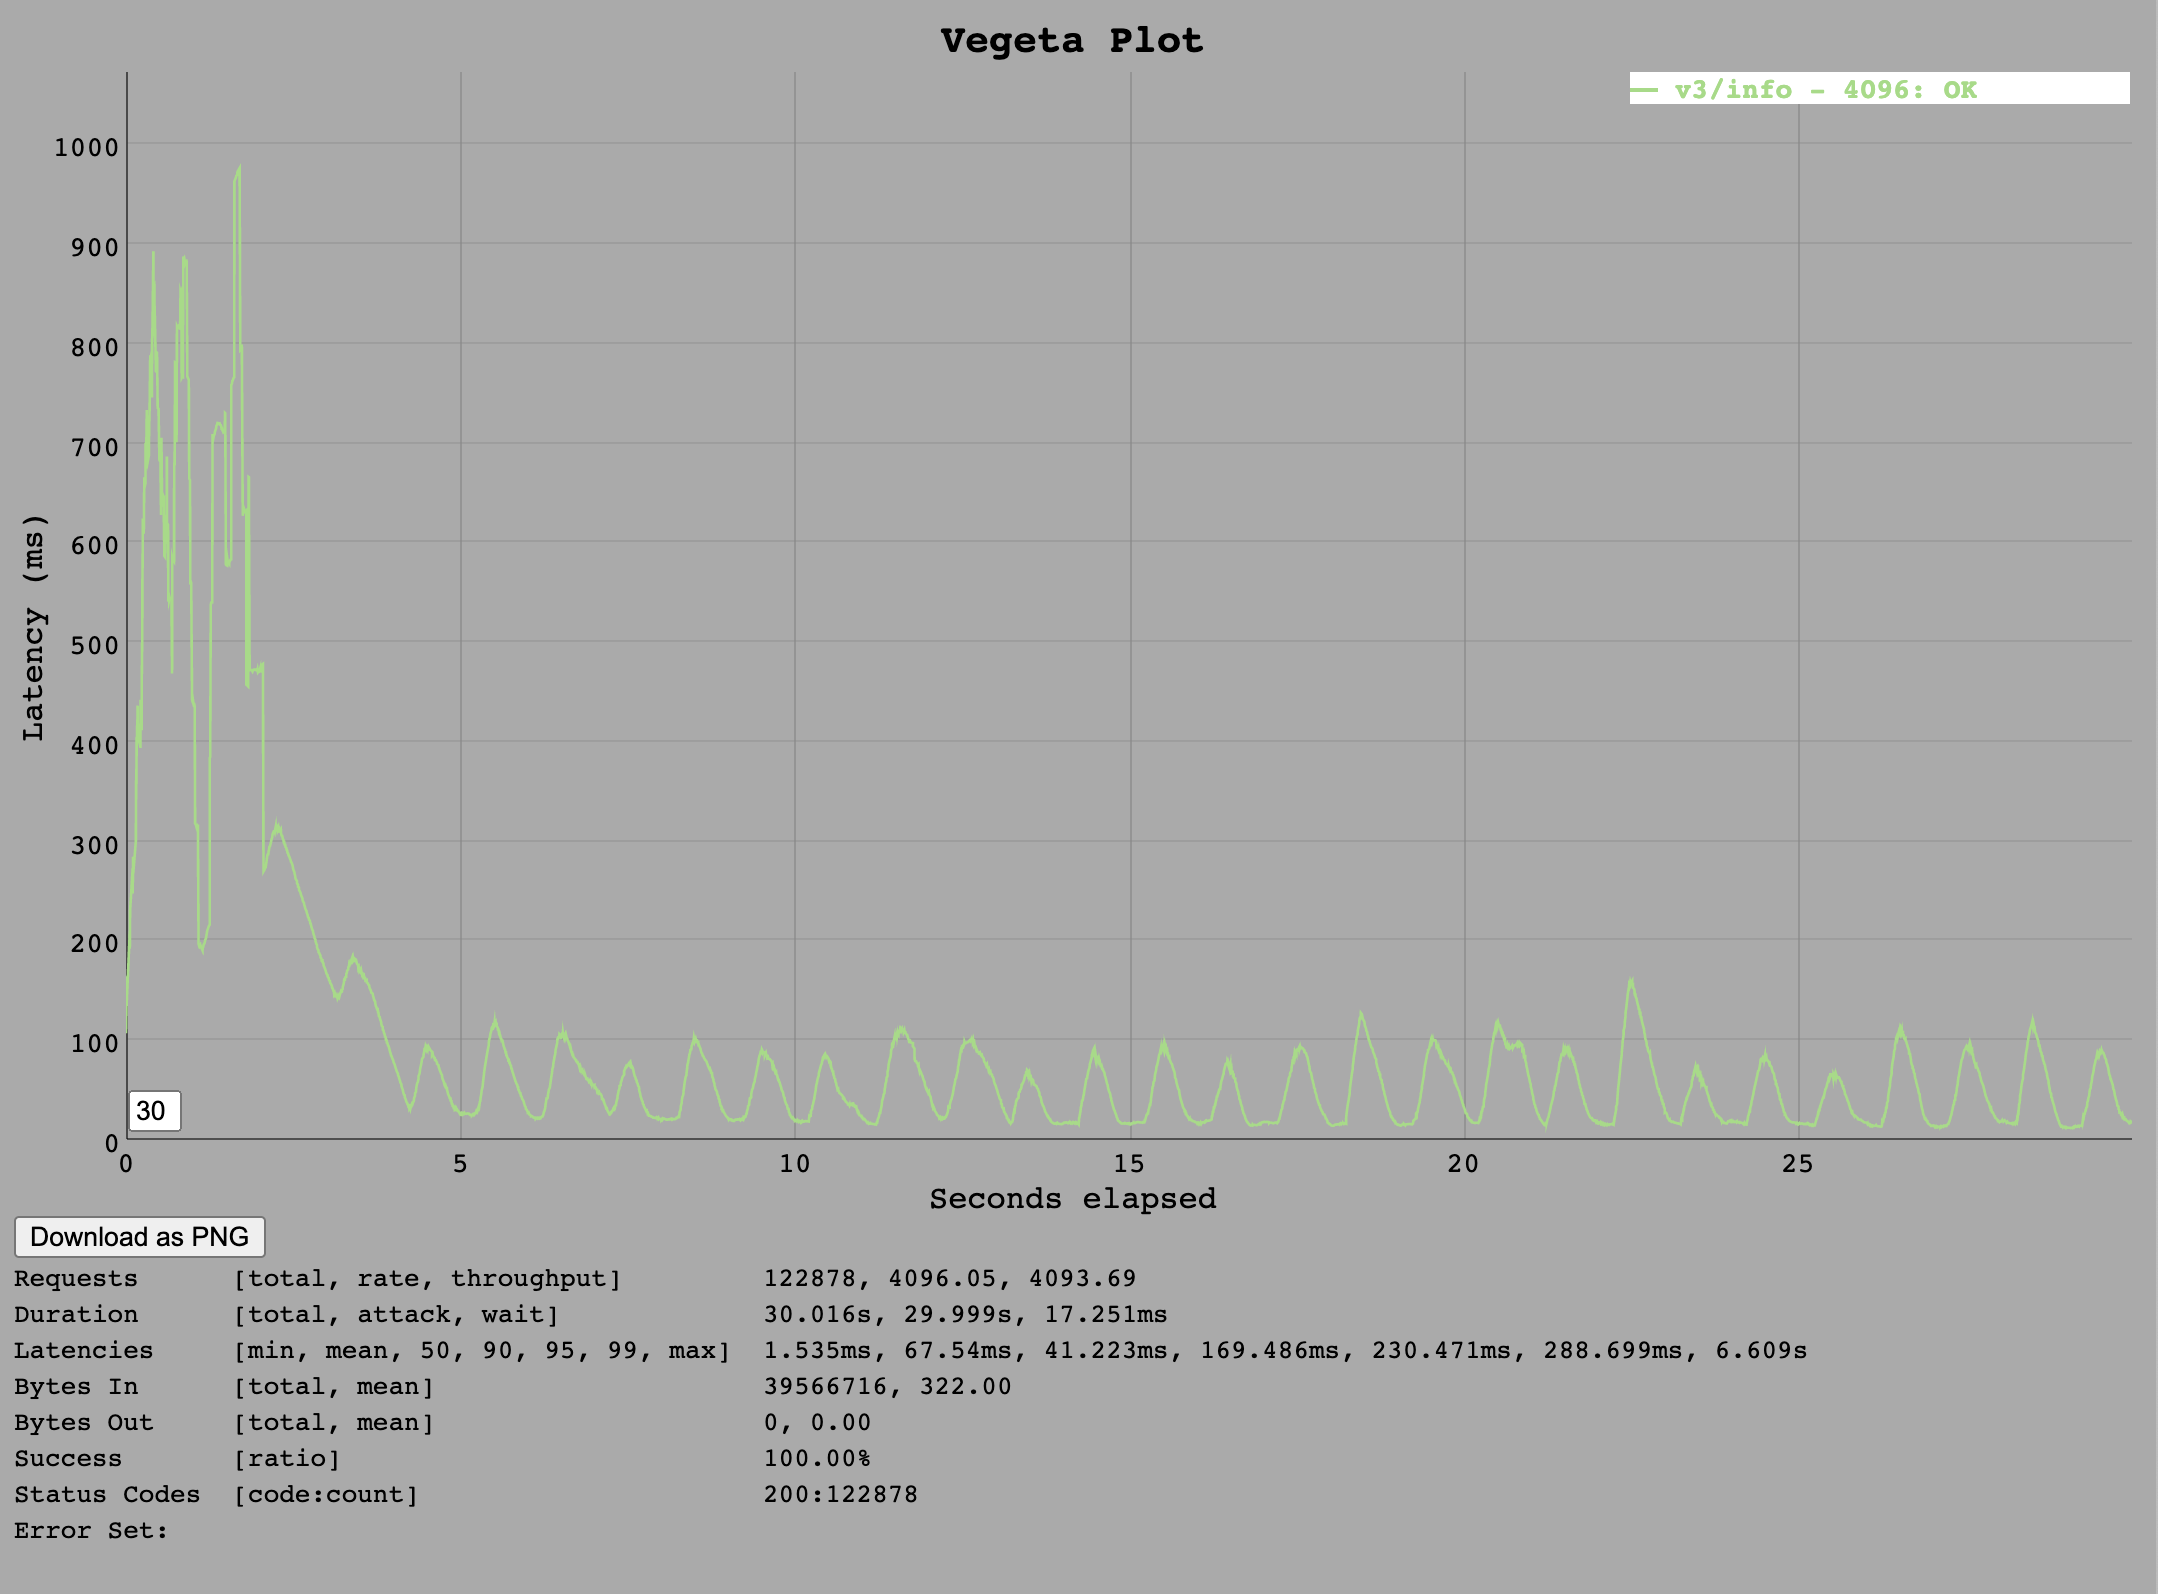
In the VM Resources Section at 4096 requests per second, the API is fully utilising all CPU resources and so is likely limited by CPU. In high load situations, the HAProxy process also seems to consume a lot of CPU. In this case HAProxy consumed 2.5 Cores while the Go process consumed roughly 1 core.
/v3/buildpacks
The /v3/buildpacks endpoint is an endpoint that requires no role checking but does require authentication and performs relatively simple SQL queries on a single table. This test is intended to show the maximum load of a simple list endpoint for both implementations.
Ruby Implementation
For the Ruby implementation we saw that at a rate of 32 requests per seconds generally works but with a throughput of only 27 requests per second, whilst the test at 64 requests per second causes the instance to fail with the same behaviour as seen in the /v3/info test.
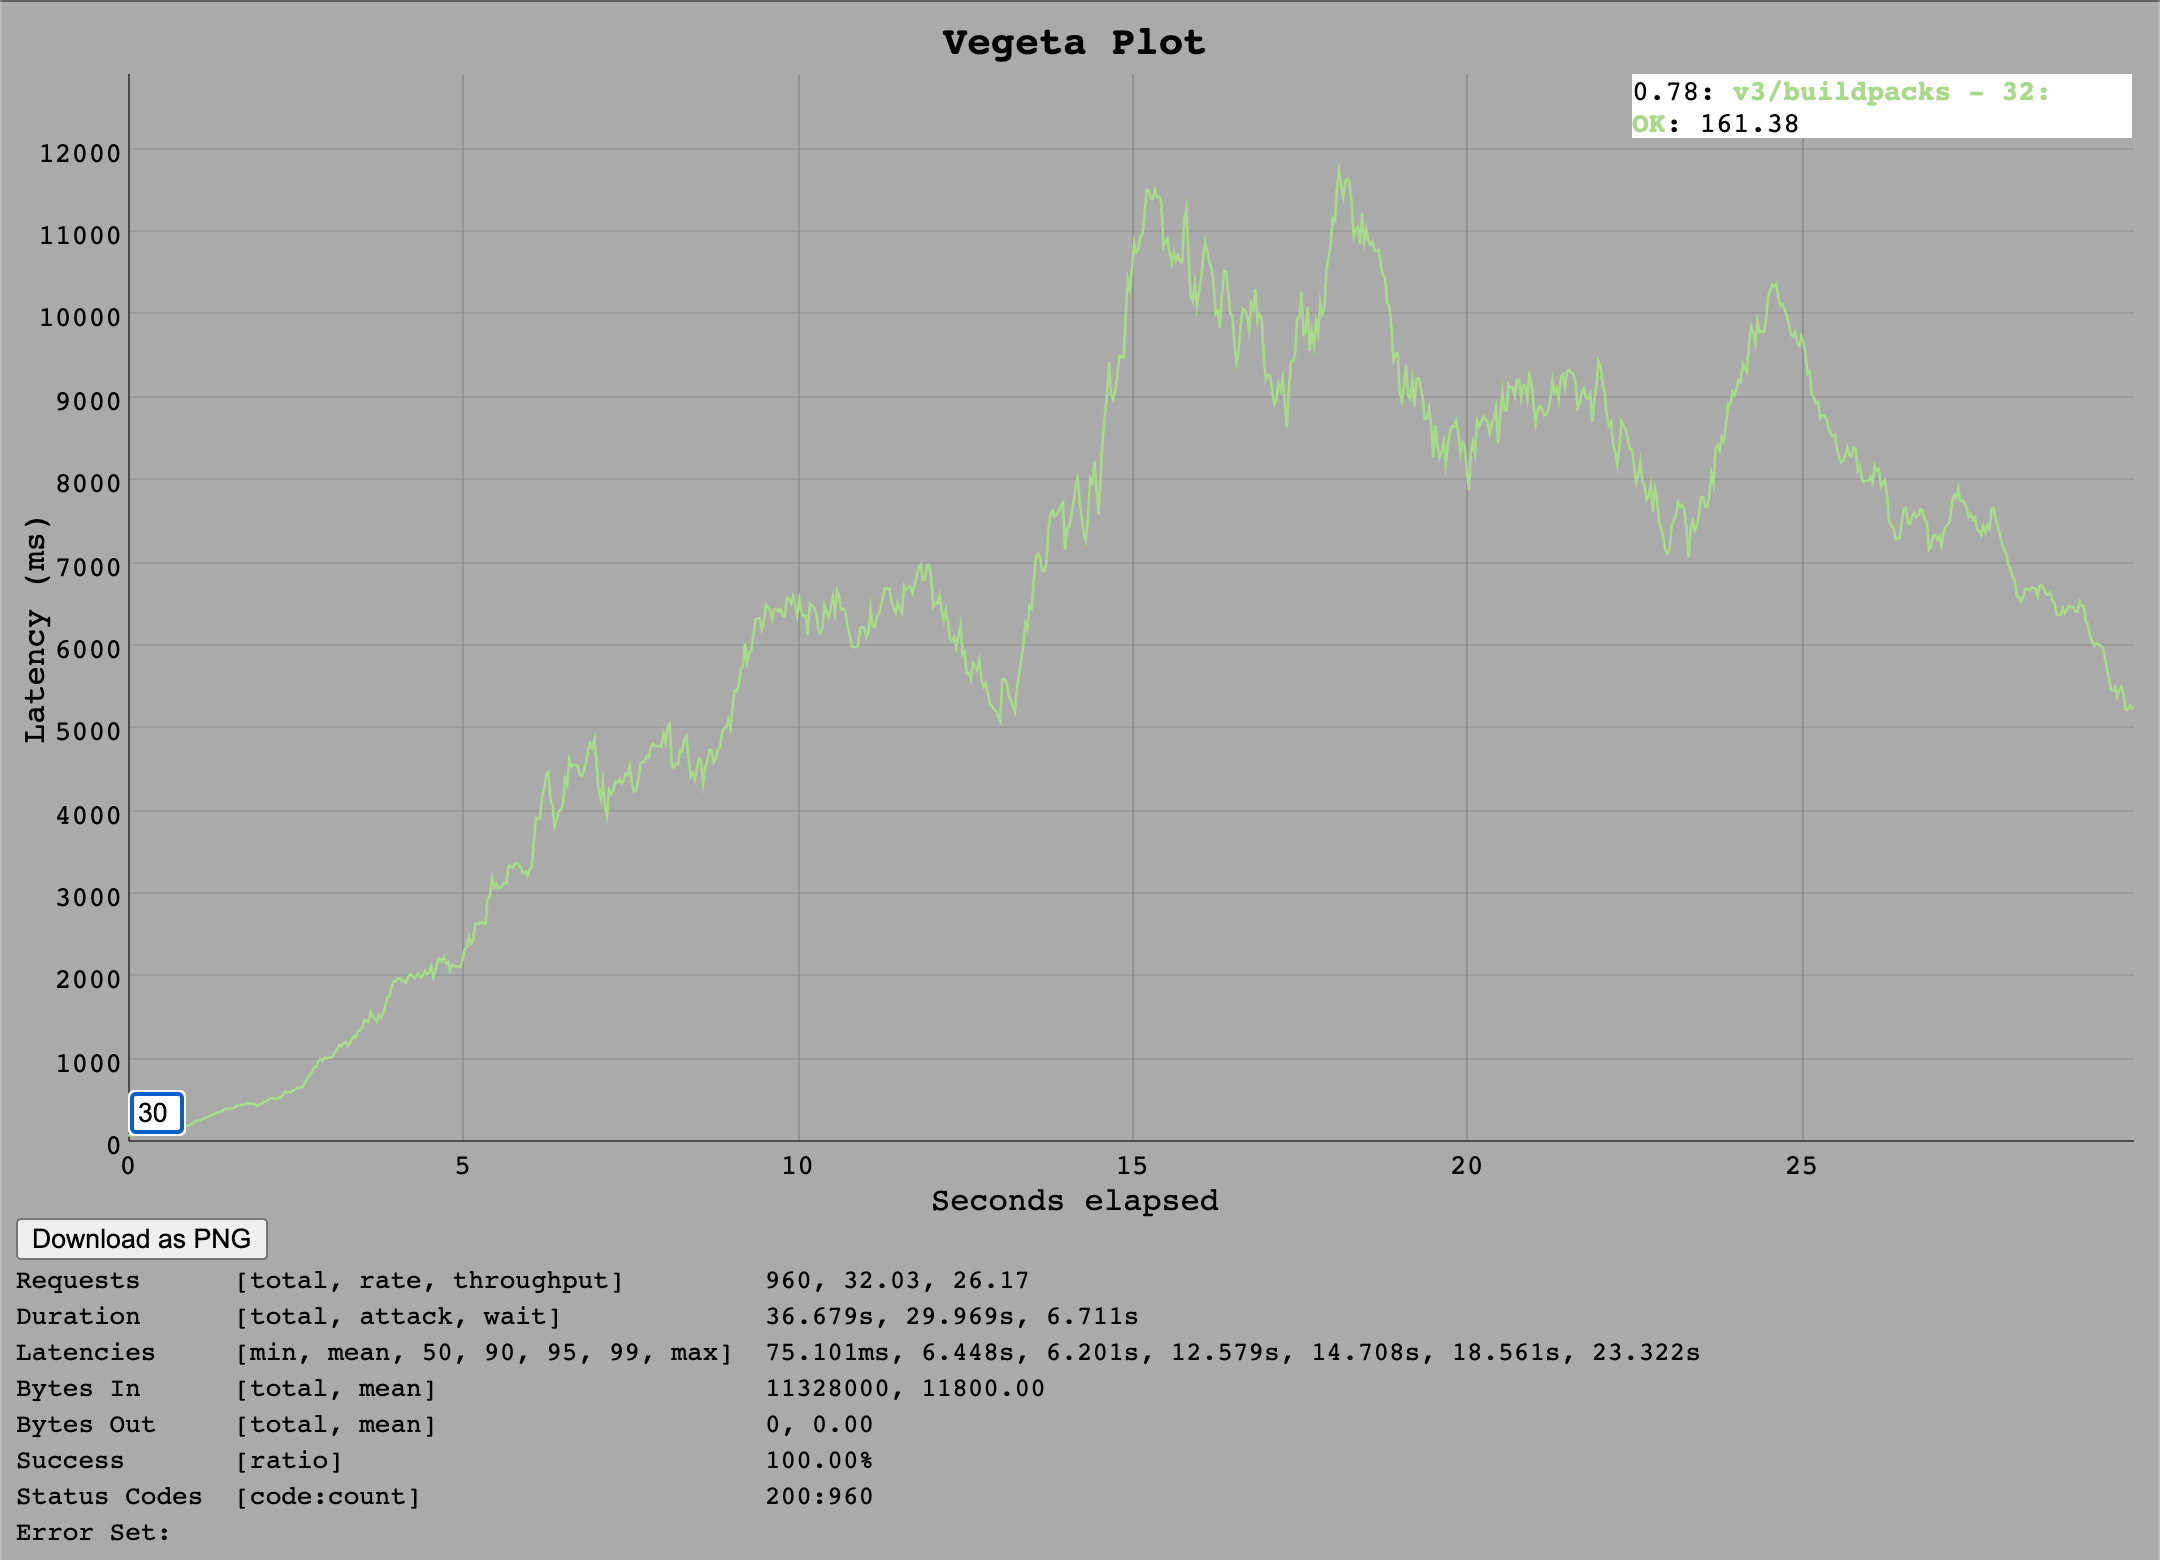
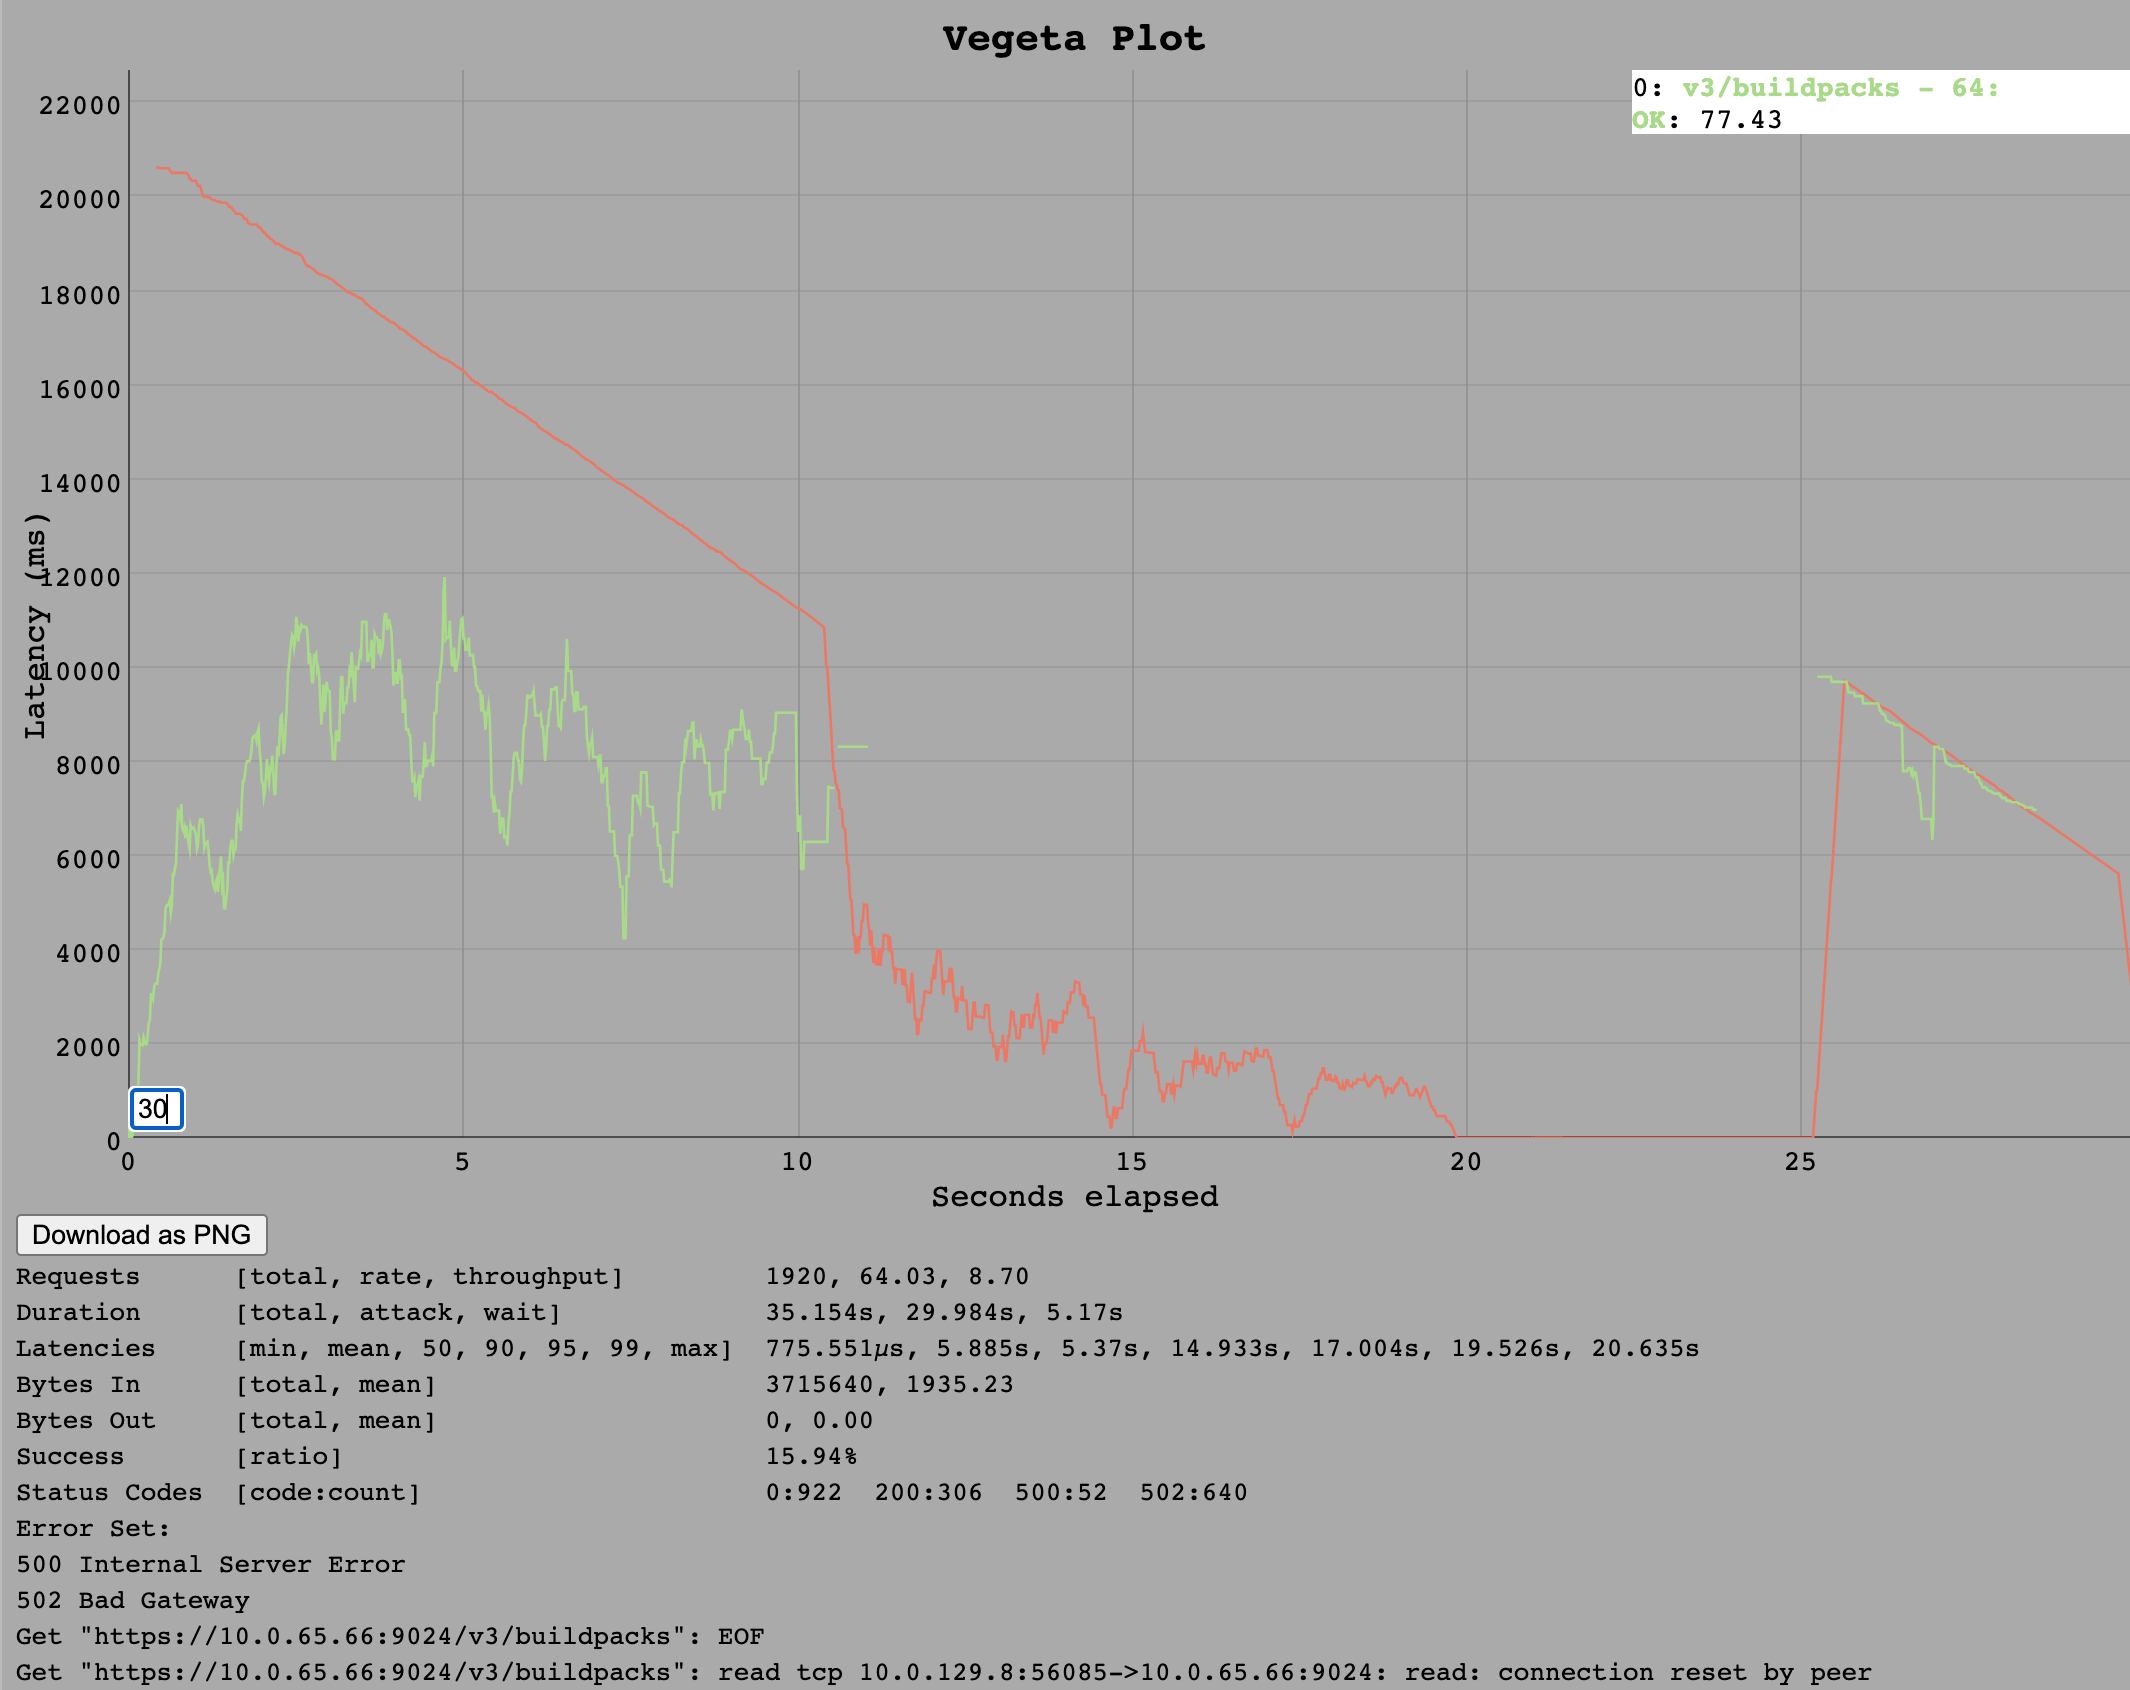
So the estimated maximum would be around 30 requests per second since in the VM Resources Section we see no overall resource limitation rather the Ruby thread using its full single core already at 32 requests per second. Additionally the throughput of 27 tells us that a backlog of requests is starting to build up already.
Go Implementation
For the Go implementation, we see some requests timing out on the client side (30s timeout) at around 1k requests per second.
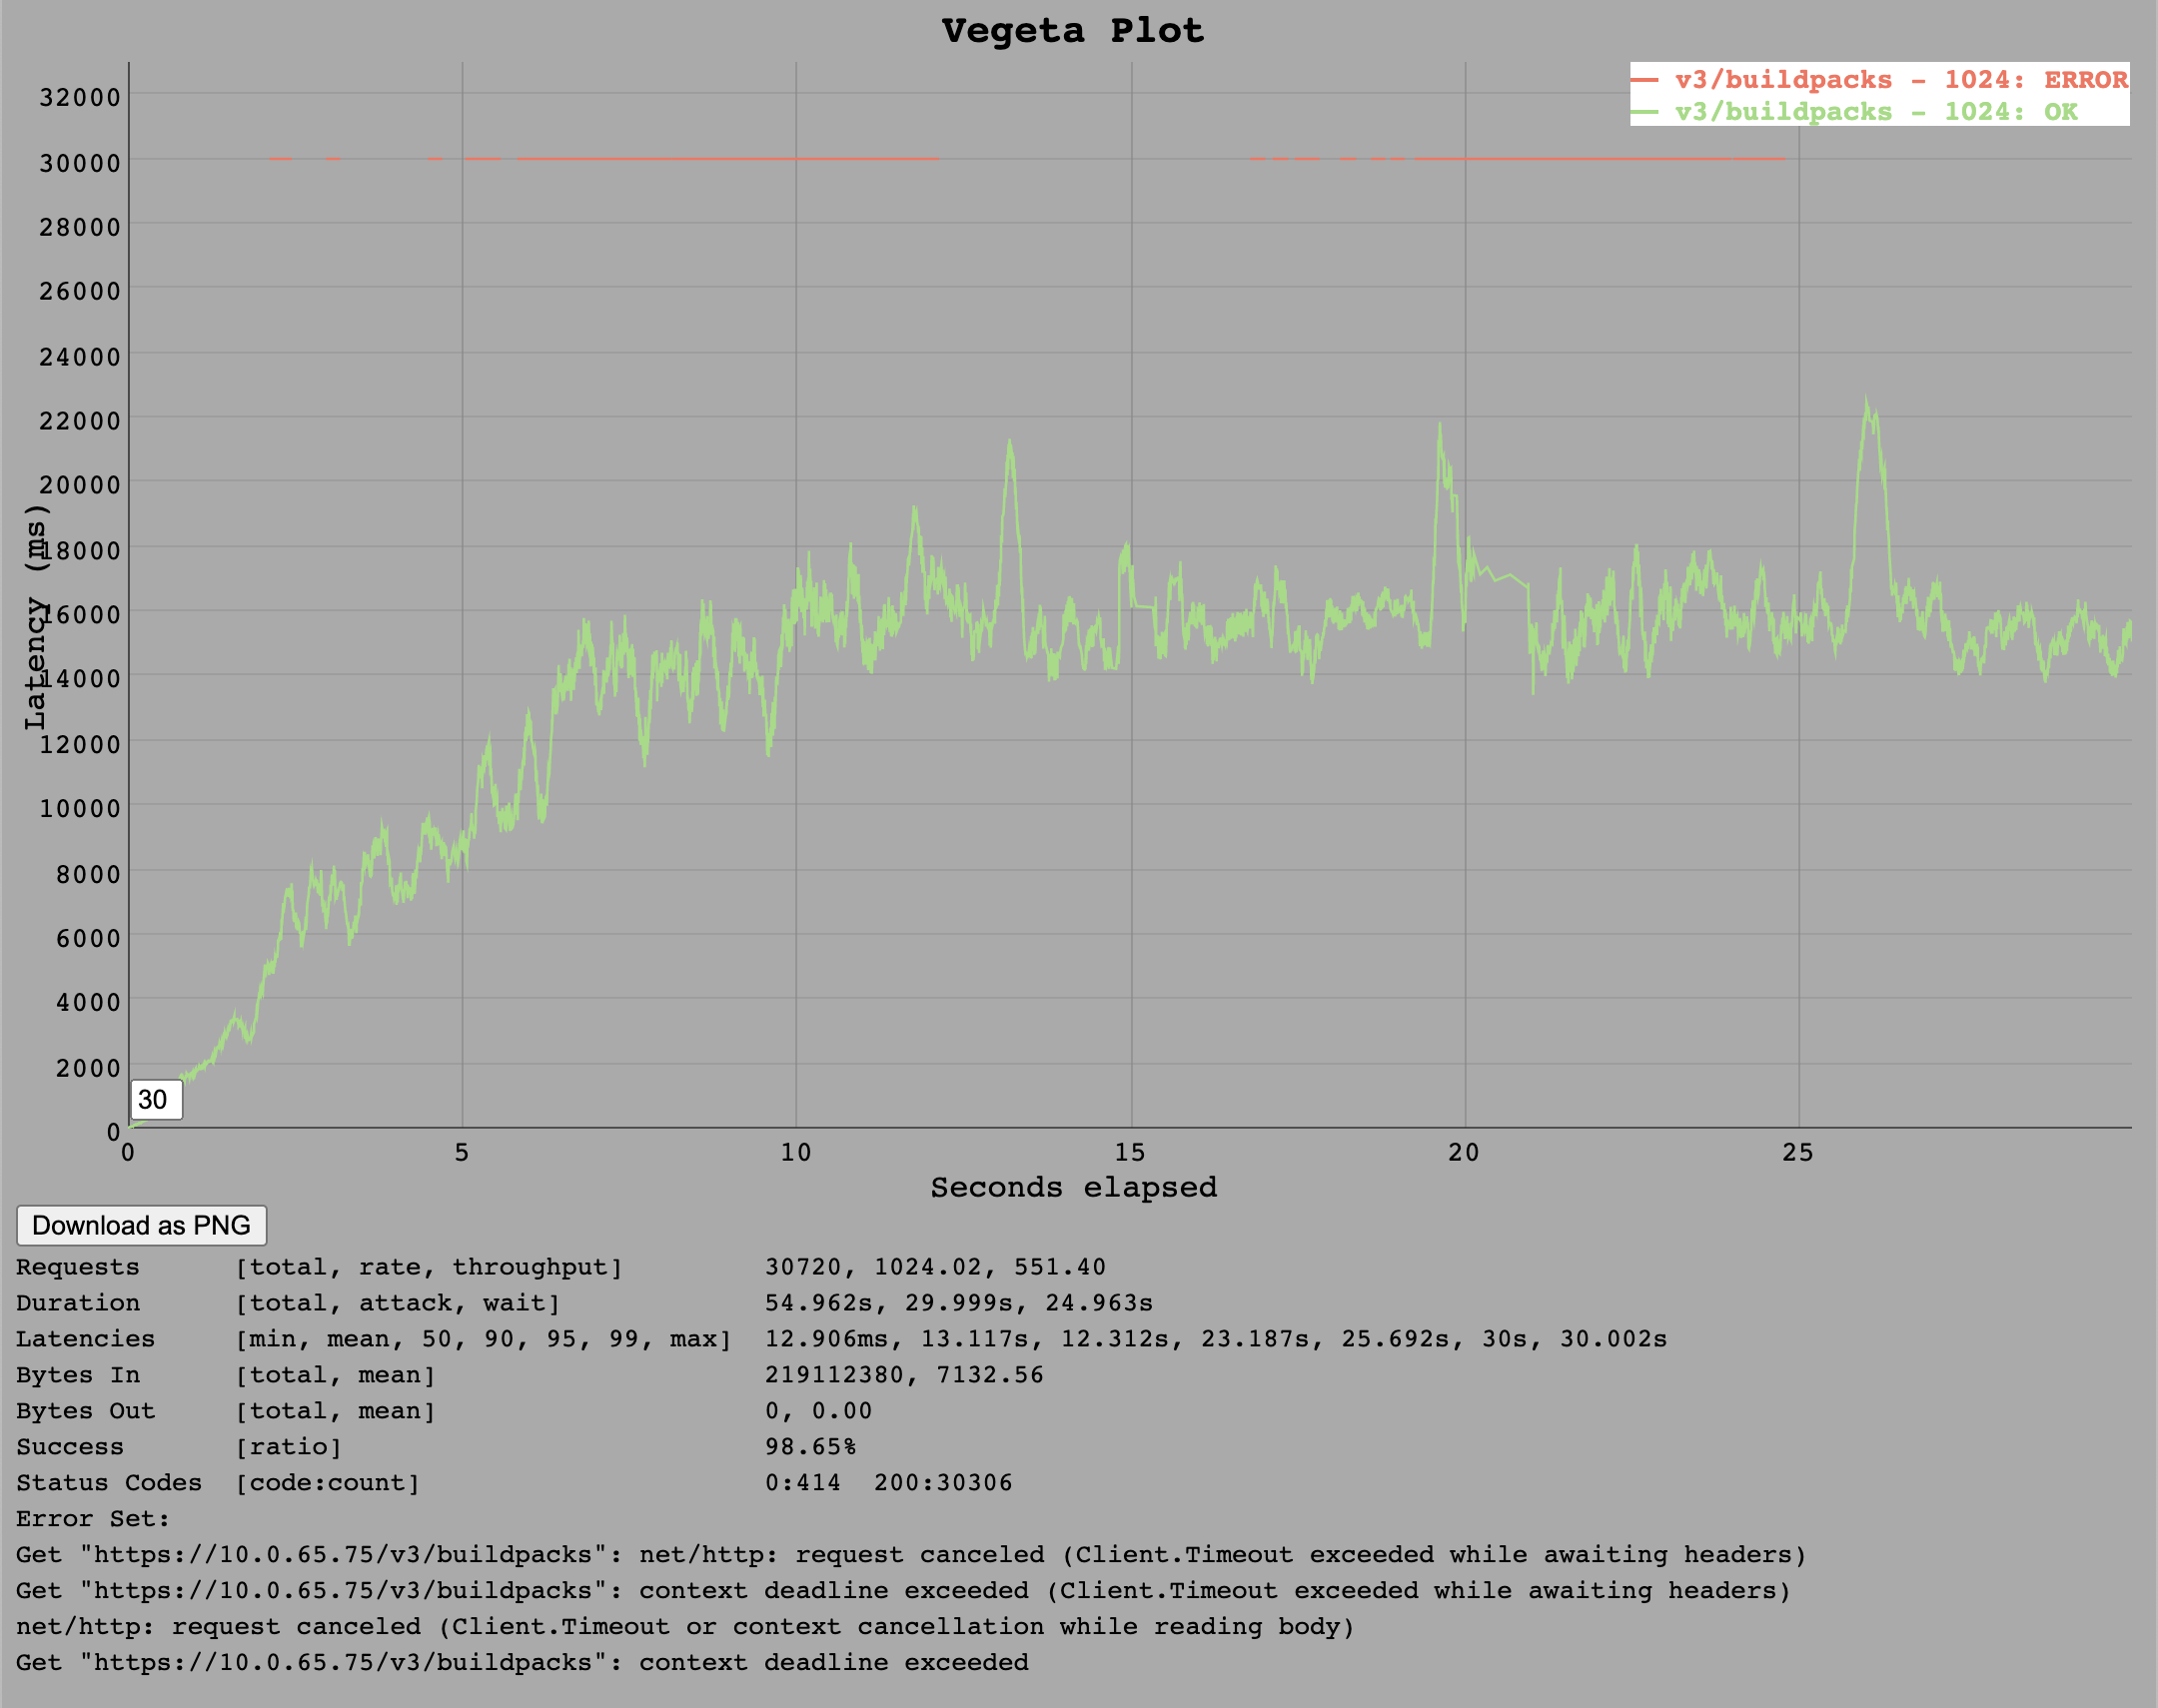 It is possible that these requests would still have been served eventually but the default timeout for the test client defines that every request longer than 30 seconds counts as failed.
It appears that somewhere around 550 requests per second is upper limit for this endpoint as this was roughly the average throughput.
/v3/security_groups/:guid
The /v3/security_groups/:guid endpoint involves checking of roles and also has links to spaces via multiple SQL joins. It has more complex queries and also through the high number of security_groups in the database, we can test how the implementations can cope with higher processing times in the DB. Ideally we would have liked to test the list security_groups endpoint but that was not yet implemented in Go at the time these tests were conducted.
Ruby Implementation
For the Ruby implementation we saw, again, that a rate of 64 requests per second overloads the cloud_controller_ng due to the Ruby process using the entire single thread it has access to.
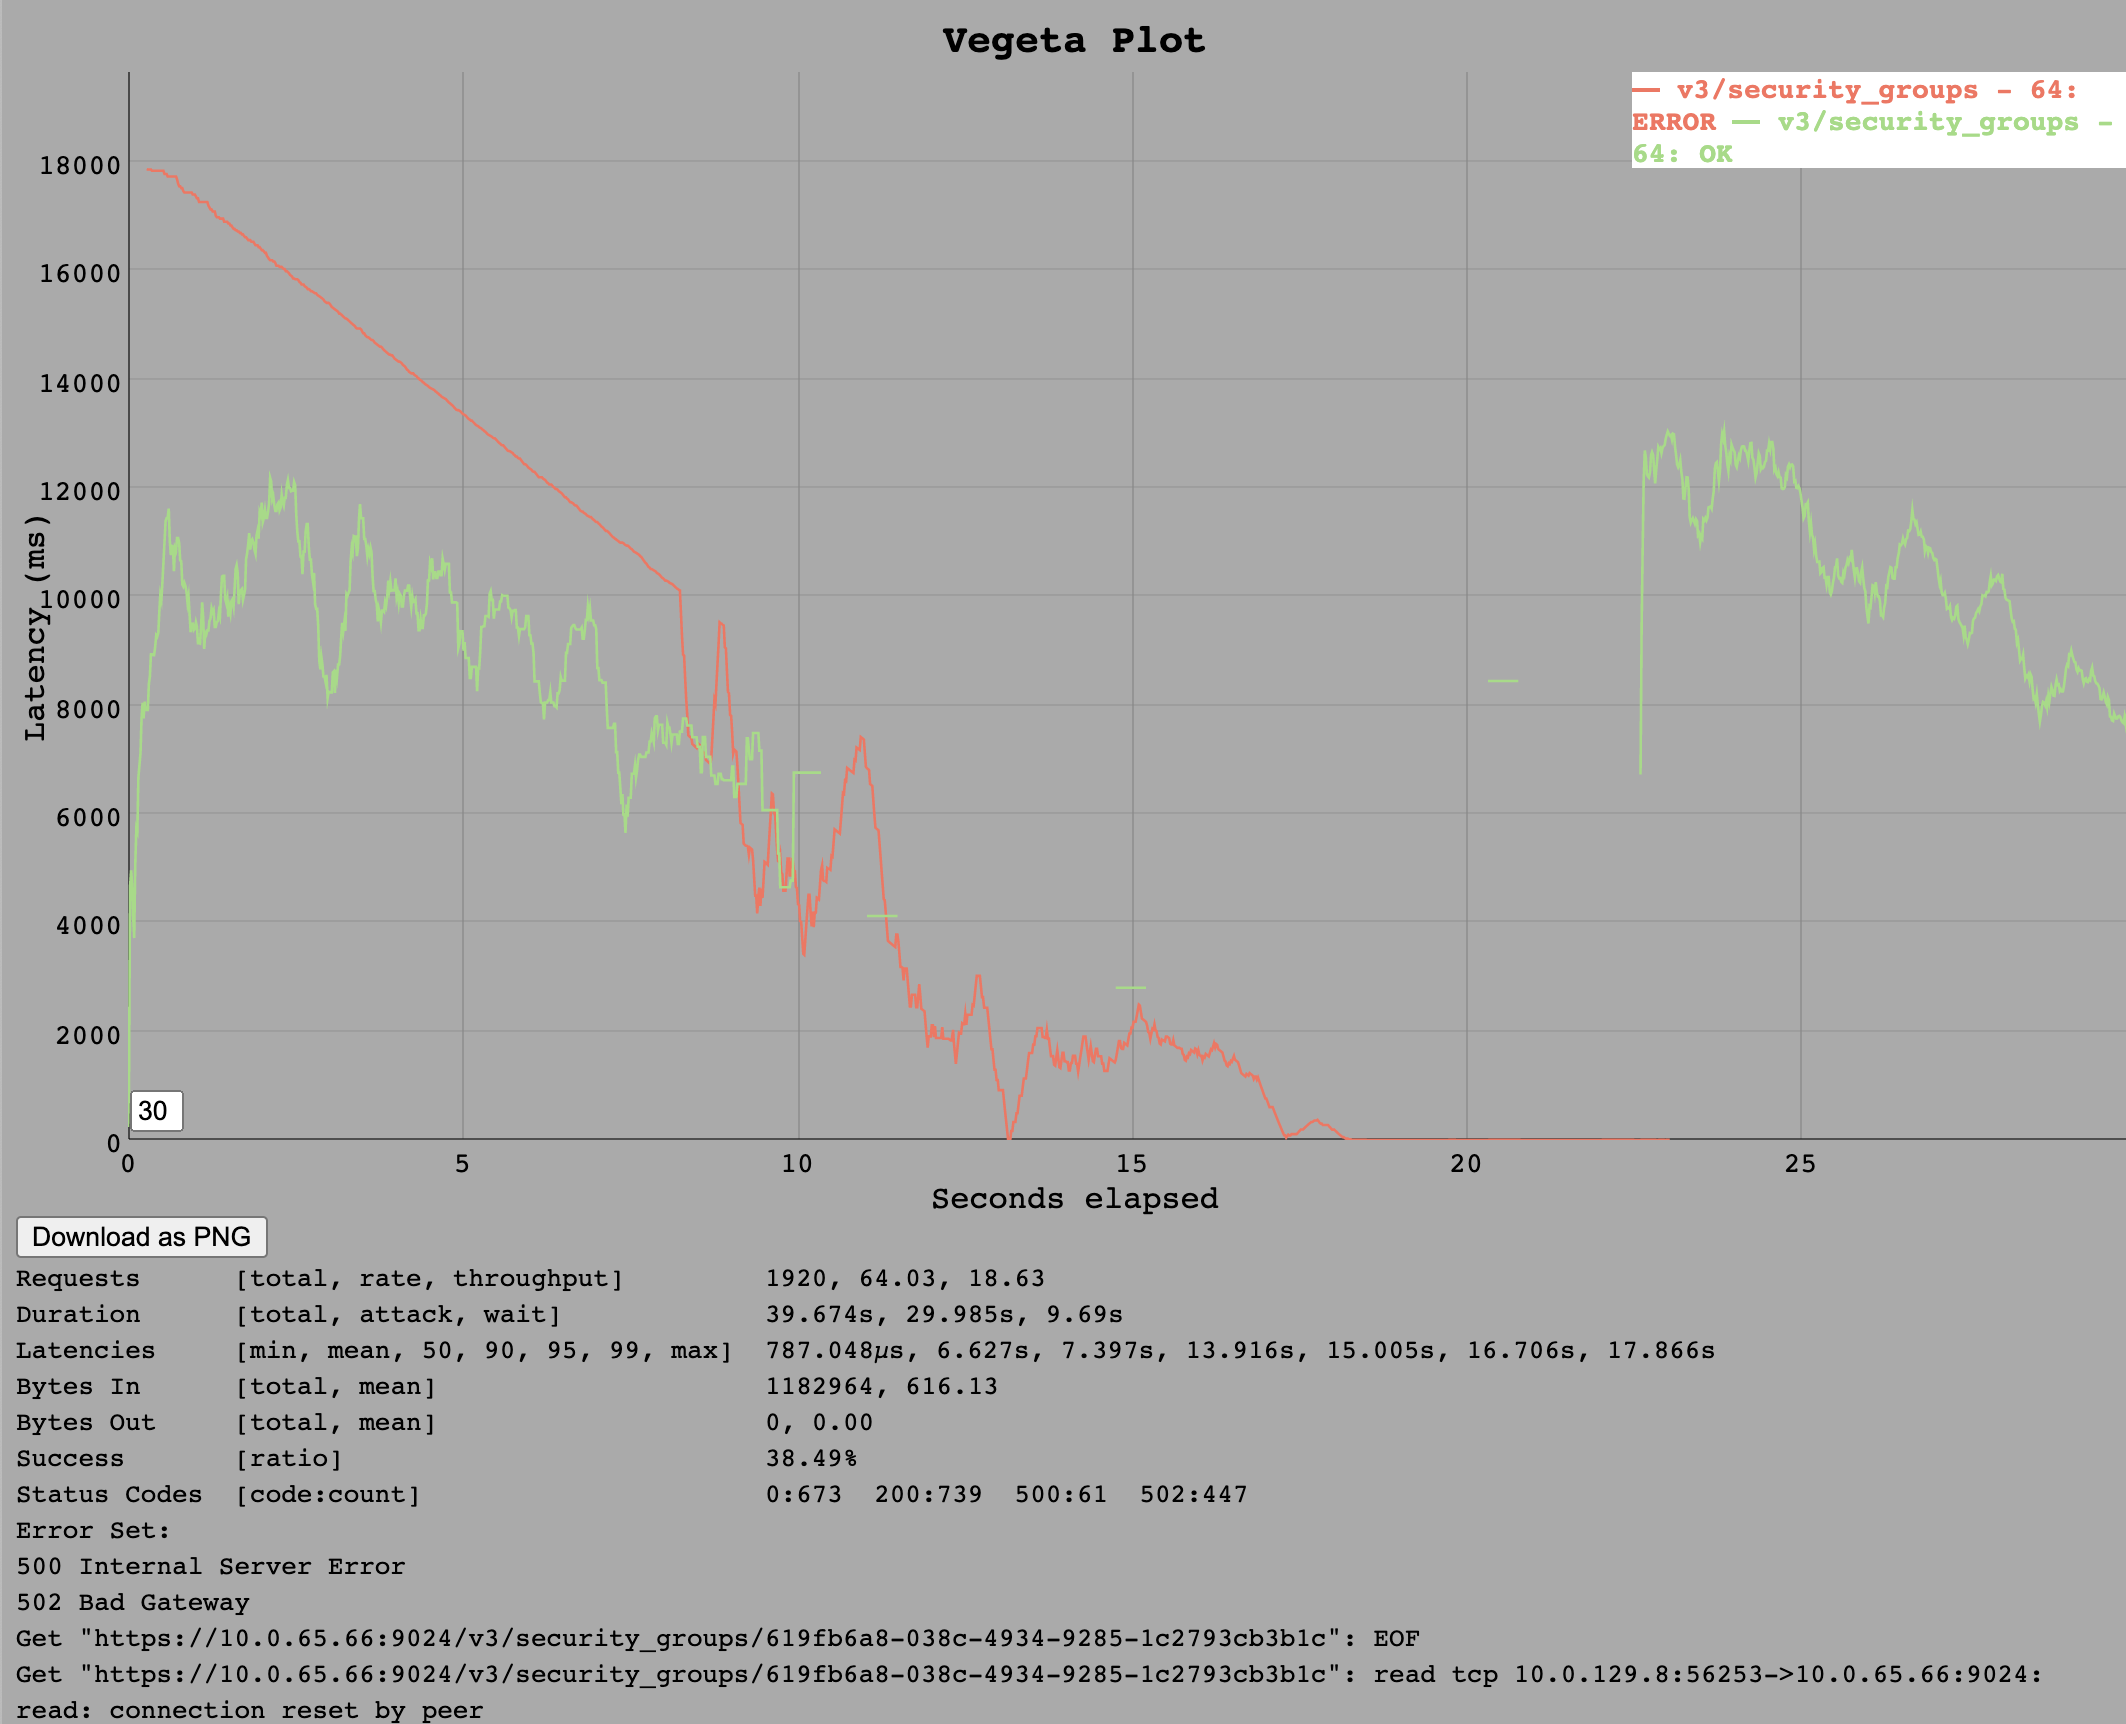
However, this time the throughput during the test at 32 requests per second was the full 32 requests per second so it seems the /v3/security_groups/:guid is a bit cheaper on the CPU. Although the single Ruby thread does appear to already be exhausted at this rate so the estimated sustainable throughput is around 40 requests per second.
Go Implementation
For the /v3/security_groups/:guid endpoint we also see a limit of around 1k requests per second. This does seem like a slight improvement over /v3/buildpacks as at 1k requests, all requests were served within the 30s timeout limit.
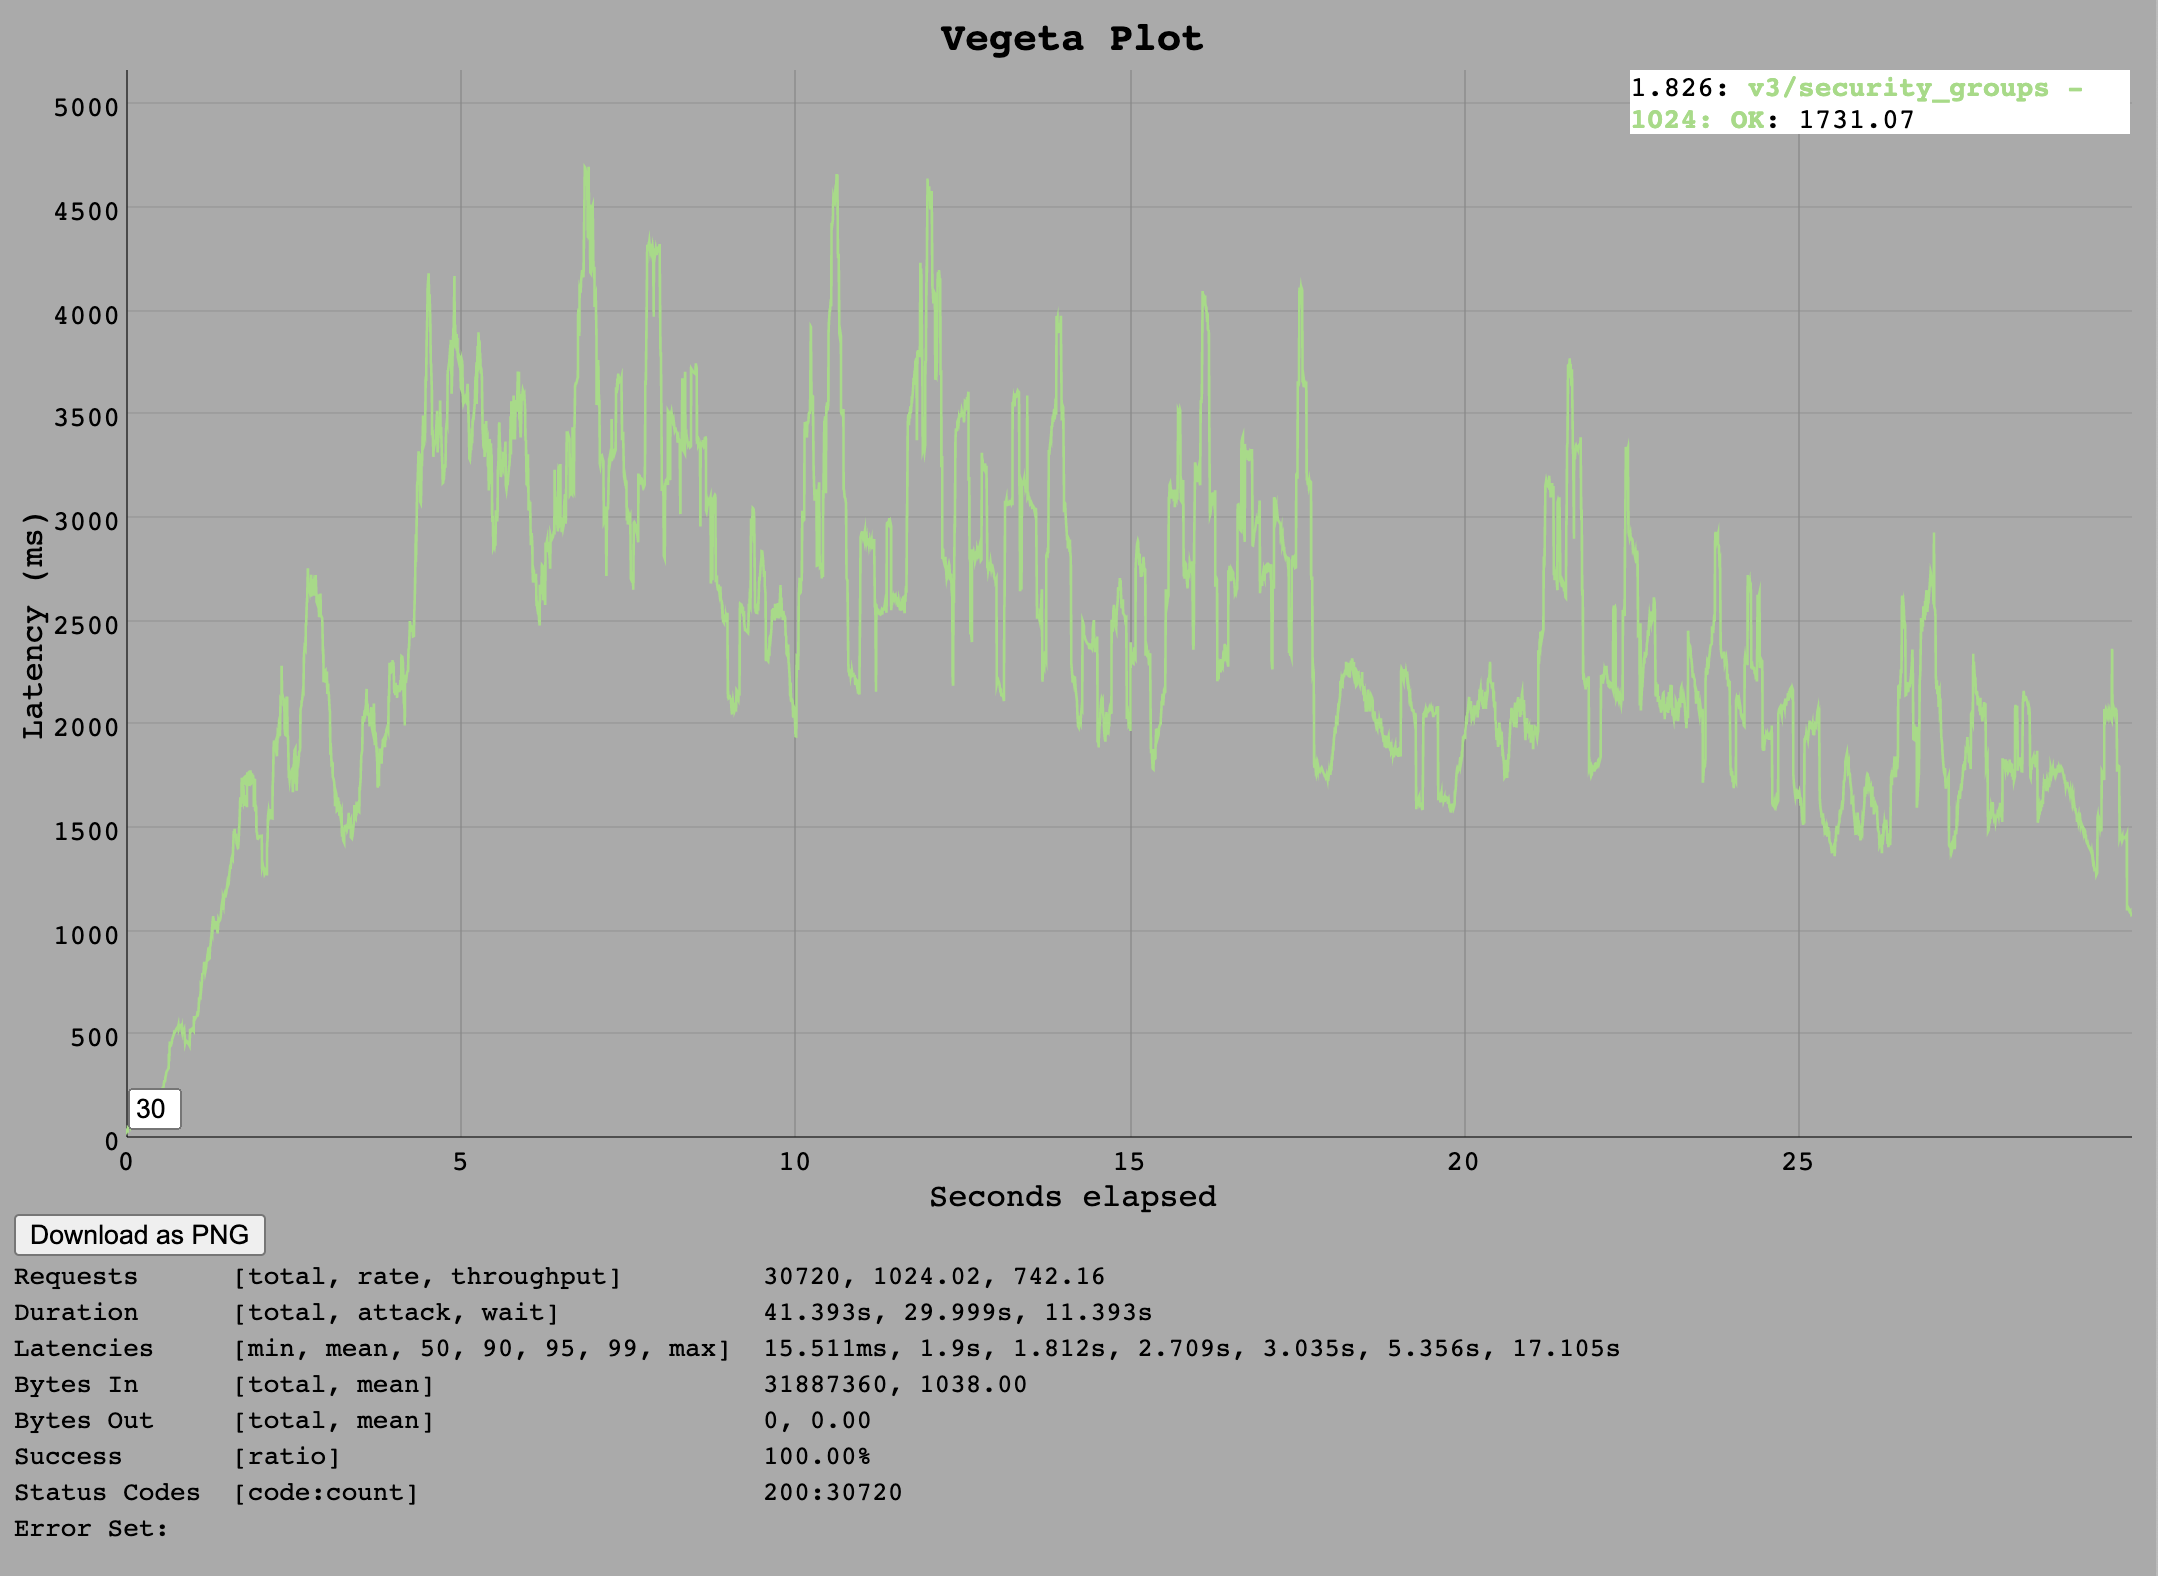
Based on the throughput numbers, a sustained load of 750 requests per second seems realistic.
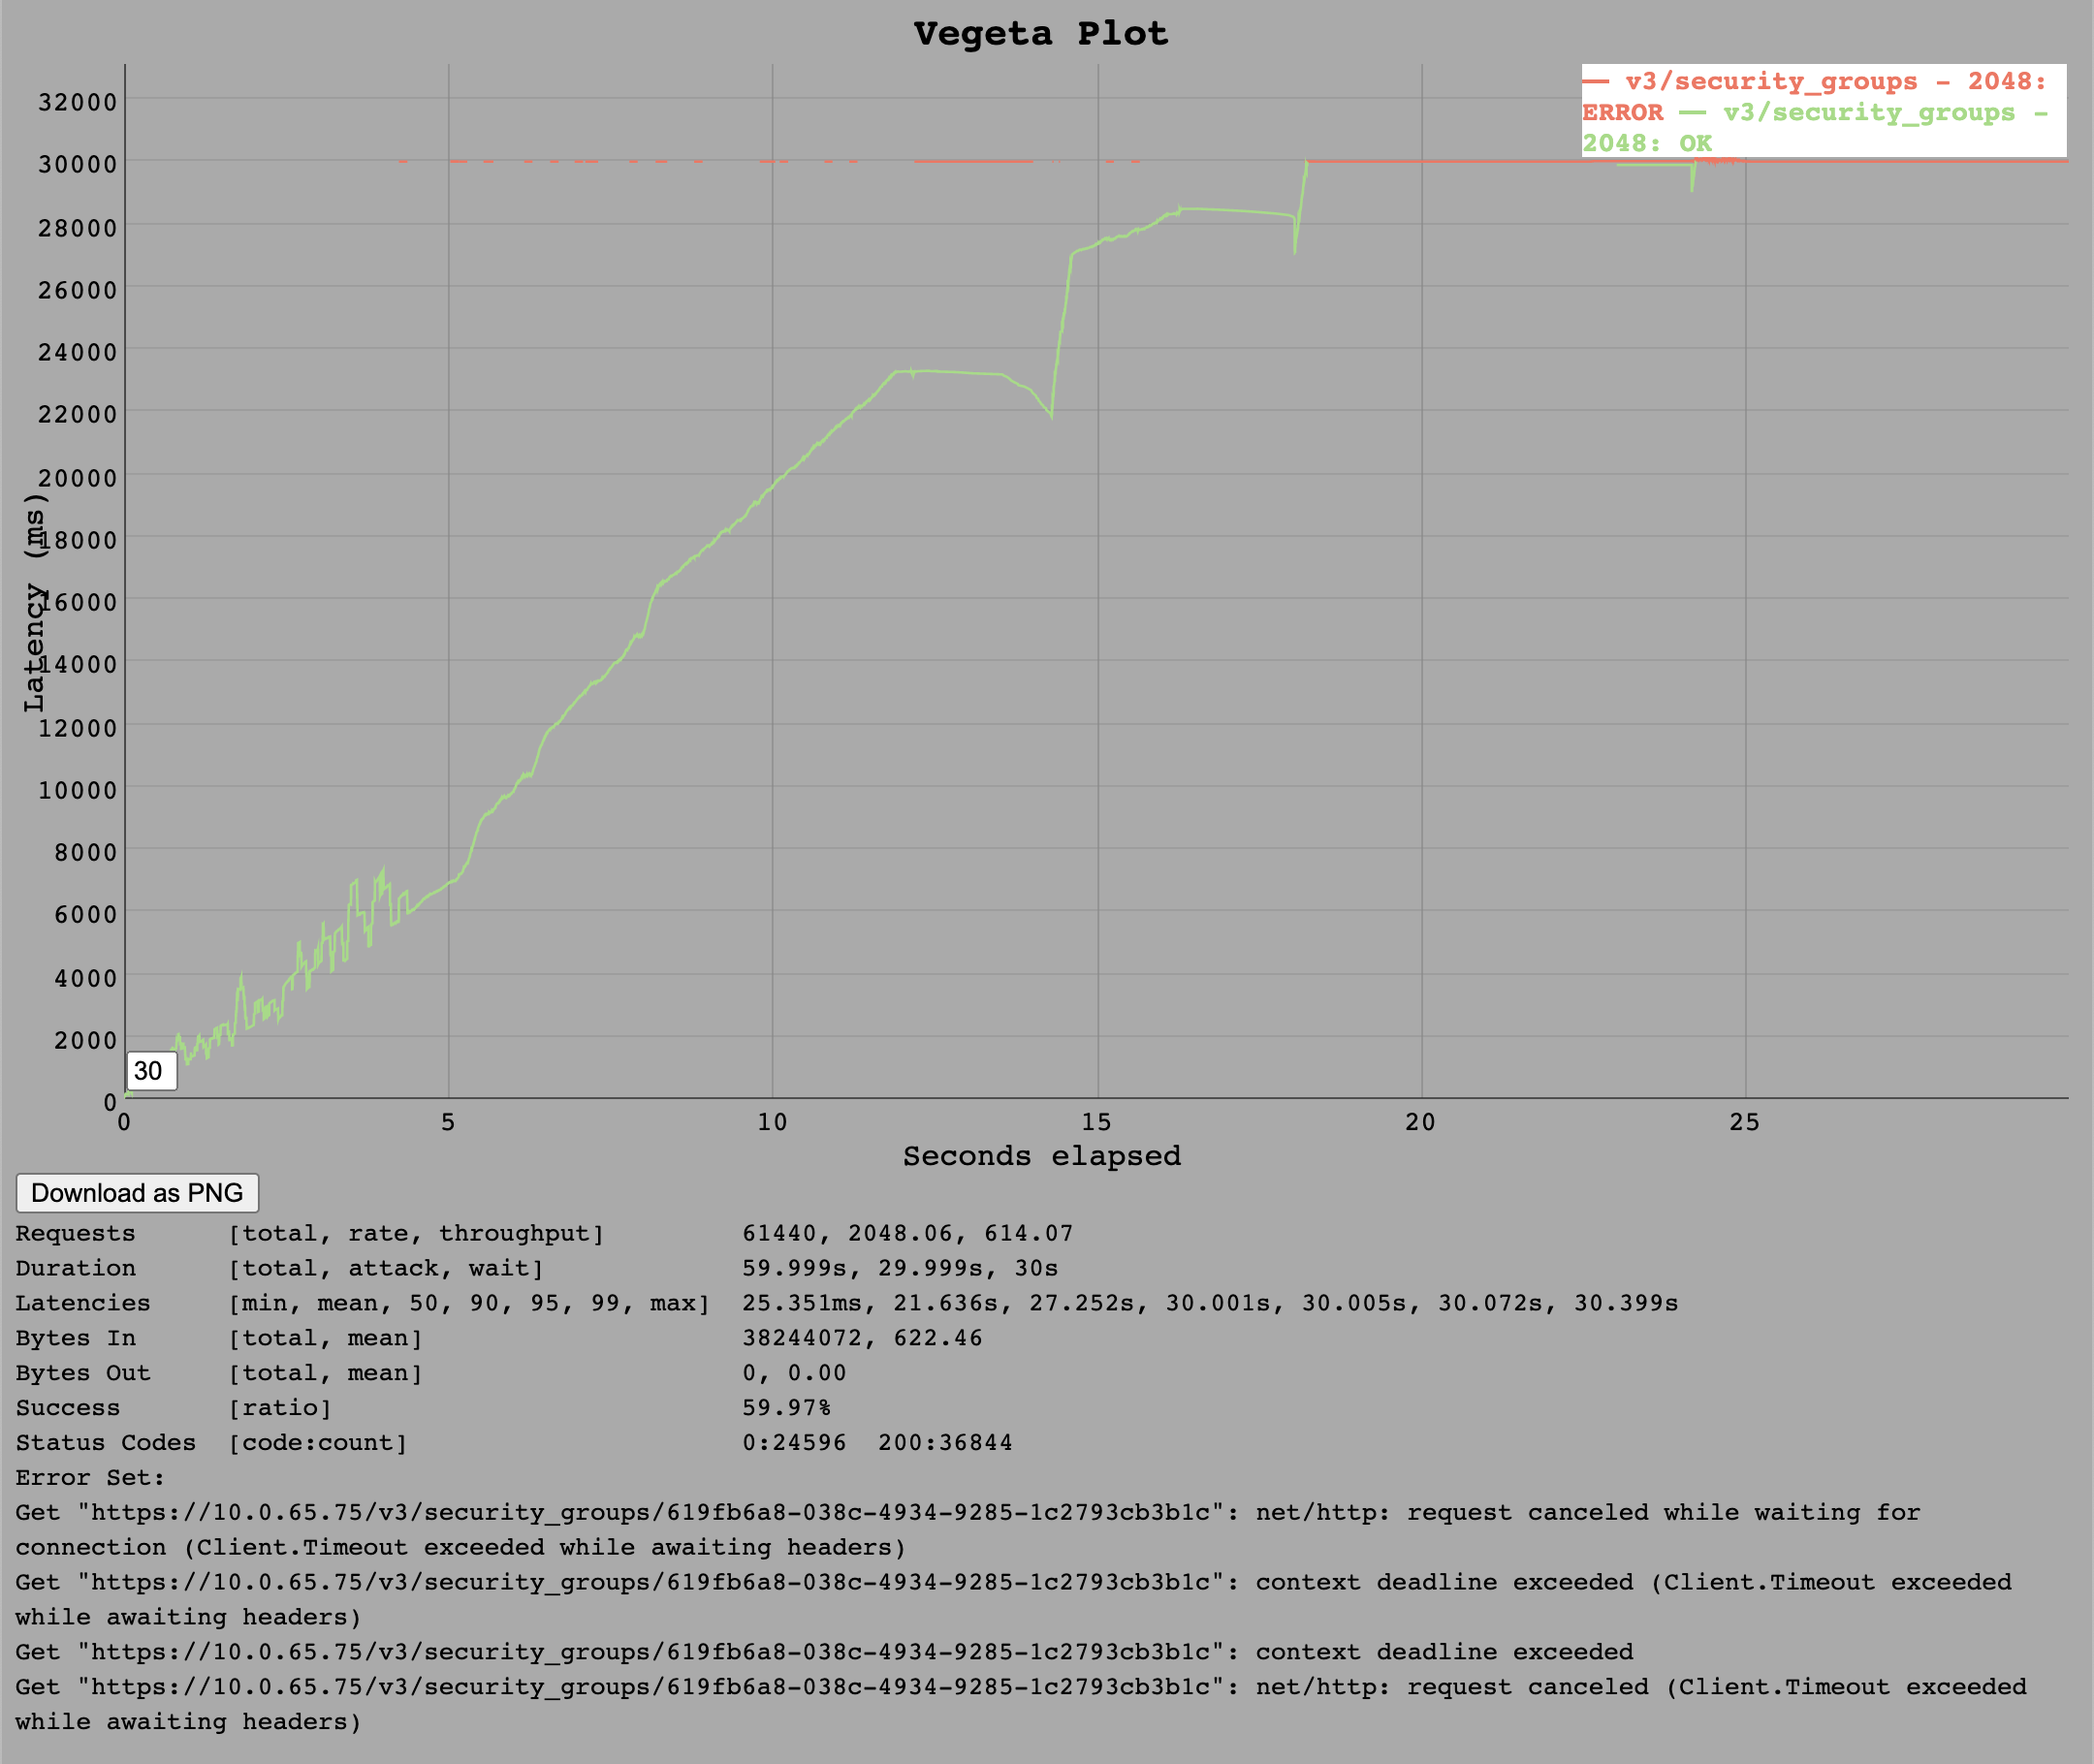
A interesting behaviour in comparison to cloud_controller_ng can be seen at a rate of 2k requests per second.
The response times rise for nearly 20 seconds until all requests run into a timeout. Yet no server error was visible - just a large increase in latencies.
VM Resources
Here are the recordings of the system resources while executing the test. The full data is available as netdata dump in the raw results tarball archive.
Go Implementation
To correlate the metrics to specific test runs, here are the timestamps of the test runs:
Targeting: https://10.0.65.75/v3/info
2021-11-03 08:56:07.314080 - Using attack rate: 8 - {"body": "", "header": {"Authorization": "REDACTED"}, "method": "GET", "url": "https://10.0.65.75/v3/info"}
2021-11-03 08:56:57.638468 - Using attack rate: 16 - {"body": "", "header": {"Authorization": "REDACTED"}, "method": "GET", "url": "https://10.0.65.75/v3/info"}
2021-11-03 08:57:47.913230 - Using attack rate: 24 - {"body": "", "header": {"Authorization": "REDACTED"}, "method": "GET", "url": "https://10.0.65.75/v3/info"}
2021-11-03 08:58:38.179441 - Using attack rate: 32 - {"body": "", "header": {"Authorization": "REDACTED"}, "method": "GET", "url": "https://10.0.65.75/v3/info"}
2021-11-03 08:59:28.498043 - Using attack rate: 64 - {"body": "", "header": {"Authorization": "REDACTED"}, "method": "GET", "url": "https://10.0.65.75/v3/info"}
2021-11-03 09:00:18.947272 - Using attack rate: 128 - {"body": "", "header": {"Authorization": "REDACTED"}, "method": "GET", "url": "https://10.0.65.75/v3/info"}
2021-11-03 09:01:09.172216 - Using attack rate: 256 - {"body": "", "header": {"Authorization": "REDACTED"}, "method": "GET", "url": "https://10.0.65.75/v3/info"}
2021-11-03 09:01:59.411845 - Using attack rate: 512 - {"body": "", "header": {"Authorization": "REDACTED"}, "method": "GET", "url": "https://10.0.65.75/v3/info"}
2021-11-03 09:02:49.780627 - Using attack rate: 1024 - {"body": "", "header": {"Authorization": "REDACTED"}, "method": "GET", "url": "https://10.0.65.75/v3/info"}
2021-11-03 09:03:40.089794 - Using attack rate: 2048 - {"body": "", "header": {"Authorization": "REDACTED"}, "method": "GET", "url": "https://10.0.65.75/v3/info"}
2021-11-03 09:04:30.480274 - Using attack rate: 4096 - {"body": "", "header": {"Authorization": "REDACTED"}, "method": "GET", "url": "https://10.0.65.75/v3/info"}


Targeting: https://10.0.65.75/v3/buildpacks
2021-11-03 09:05:40.888477 - Using attack rate: 8 - {"body": "", "header": {"Authorization": "REDACTED"}, "method": "GET", "url": "https://10.0.65.75/v3/buildpacks"}
2021-11-03 09:06:31.237477 - Using attack rate: 16 - {"body": "", "header": {"Authorization": "REDACTED"}, "method": "GET", "url": "https://10.0.65.75/v3/buildpacks"}
2021-11-03 09:07:21.503889 - Using attack rate: 24 - {"body": "", "header": {"Authorization": "REDACTED"}, "method": "GET", "url": "https://10.0.65.75/v3/buildpacks"}
2021-11-03 09:08:11.840010 - Using attack rate: 32 - {"body": "", "header": {"Authorization": "REDACTED"}, "method": "GET", "url": "https://10.0.65.75/v3/buildpacks"}
2021-11-03 09:09:02.160462 - Using attack rate: 64 - {"body": "", "header": {"Authorization": "REDACTED"}, "method": "GET", "url": "https://10.0.65.75/v3/buildpacks"}
2021-11-03 09:09:52.466723 - Using attack rate: 128 - {"body": "", "header": {"Authorization": "REDACTED"}, "method": "GET", "url": "https://10.0.65.75/v3/buildpacks"}
2021-11-03 09:10:42.759395 - Using attack rate: 256 - {"body": "", "header": {"Authorization": "REDACTED"}, "method": "GET", "url": "https://10.0.65.75/v3/buildpacks"}
2021-11-03 09:11:33.273219 - Using attack rate: 512 - {"body": "", "header": {"Authorization": "REDACTED"}, "method": "GET", "url": "https://10.0.65.75/v3/buildpacks"}
2021-11-03 09:12:23.564614 - Using attack rate: 1024 - {"body": "", "header": {"Authorization": "REDACTED"}, "method": "GET", "url": "https://10.0.65.75/v3/buildpacks"}
2021-11-03 09:13:38.855490 - Using attack rate: 2048 - {"body": "", "header": {"Authorization": "REDACTED"}, "method": "GET", "url": "https://10.0.65.75/v3/buildpacks"}
2021-11-03 09:14:59.447755 - Using attack rate: 4096 - {"body": "", "header": {"Authorization": "REDACTED"}, "method": "GET", "url": "https://10.0.65.75/v3/buildpacks"}


Targeting: https://10.0.65.75/v3/security_groups
2021-11-03 09:16:20.424447 - Using attack rate: 8 - {"body": "", "header": {"Authorization": "REDACTED"}, "method": "GET", "url": "https://10.0.65.75/v3/security_groups/619fb6a8-038c-4934-9285-1c2793cb3b1c"}
2021-11-03 09:17:10.786576 - Using attack rate: 16 - {"body": "", "header": {"Authorization": "REDACTED"}, "method": "GET", "url": "https://10.0.65.75/v3/security_groups/619fb6a8-038c-4934-9285-1c2793cb3b1c"}
2021-11-03 09:18:01.054648 - Using attack rate: 24 - {"body": "", "header": {"Authorization": "REDACTED"}, "method": "GET", "url": "https://10.0.65.75/v3/security_groups/619fb6a8-038c-4934-9285-1c2793cb3b1c"}
2021-11-03 09:18:51.309282 - Using attack rate: 32 - {"body": "", "header": {"Authorization": "REDACTED"}, "method": "GET", "url": "https://10.0.65.75/v3/security_groups/619fb6a8-038c-4934-9285-1c2793cb3b1c"}
2021-11-03 09:19:41.730875 - Using attack rate: 64 - {"body": "", "header": {"Authorization": "REDACTED"}, "method": "GET", "url": "https://10.0.65.75/v3/security_groups/619fb6a8-038c-4934-9285-1c2793cb3b1c"}
2021-11-03 09:20:32.027494 - Using attack rate: 128 - {"body": "", "header": {"Authorization": "REDACTED"}, "method": "GET", "url": "https://10.0.65.75/v3/security_groups/619fb6a8-038c-4934-9285-1c2793cb3b1c"}
2021-11-03 09:21:22.264486 - Using attack rate: 256 - {"body": "", "header": {"Authorization": "REDACTED"}, "method": "GET", "url": "https://10.0.65.75/v3/security_groups/619fb6a8-038c-4934-9285-1c2793cb3b1c"}
2021-11-03 09:22:12.736188 - Using attack rate: 512 - {"body": "", "header": {"Authorization": "REDACTED"}, "method": "GET", "url": "https://10.0.65.75/v3/security_groups/619fb6a8-038c-4934-9285-1c2793cb3b1c"}
2021-11-03 09:23:03.124116 - Using attack rate: 1024 - {"body": "", "header": {"Authorization": "REDACTED"}, "method": "GET", "url": "https://10.0.65.75/v3/security_groups/619fb6a8-038c-4934-9285-1c2793cb3b1c"}
2021-11-03 09:24:04.777251 - Using attack rate: 2048 - {"body": "", "header": {"Authorization": "REDACTED"}, "method": "GET", "url": "https://10.0.65.75/v3/security_groups/619fb6a8-038c-4934-9285-1c2793cb3b1c"}
2021-11-03 09:25:25.160157 - Using attack rate: 4096 - {"body": "", "header": {"Authorization": "REDACTED"}, "method": "GET", "url": "https://10.0.65.75/v3/security_groups/619fb6a8-038c-4934-9285-1c2793cb3b1c"}
CPU Load
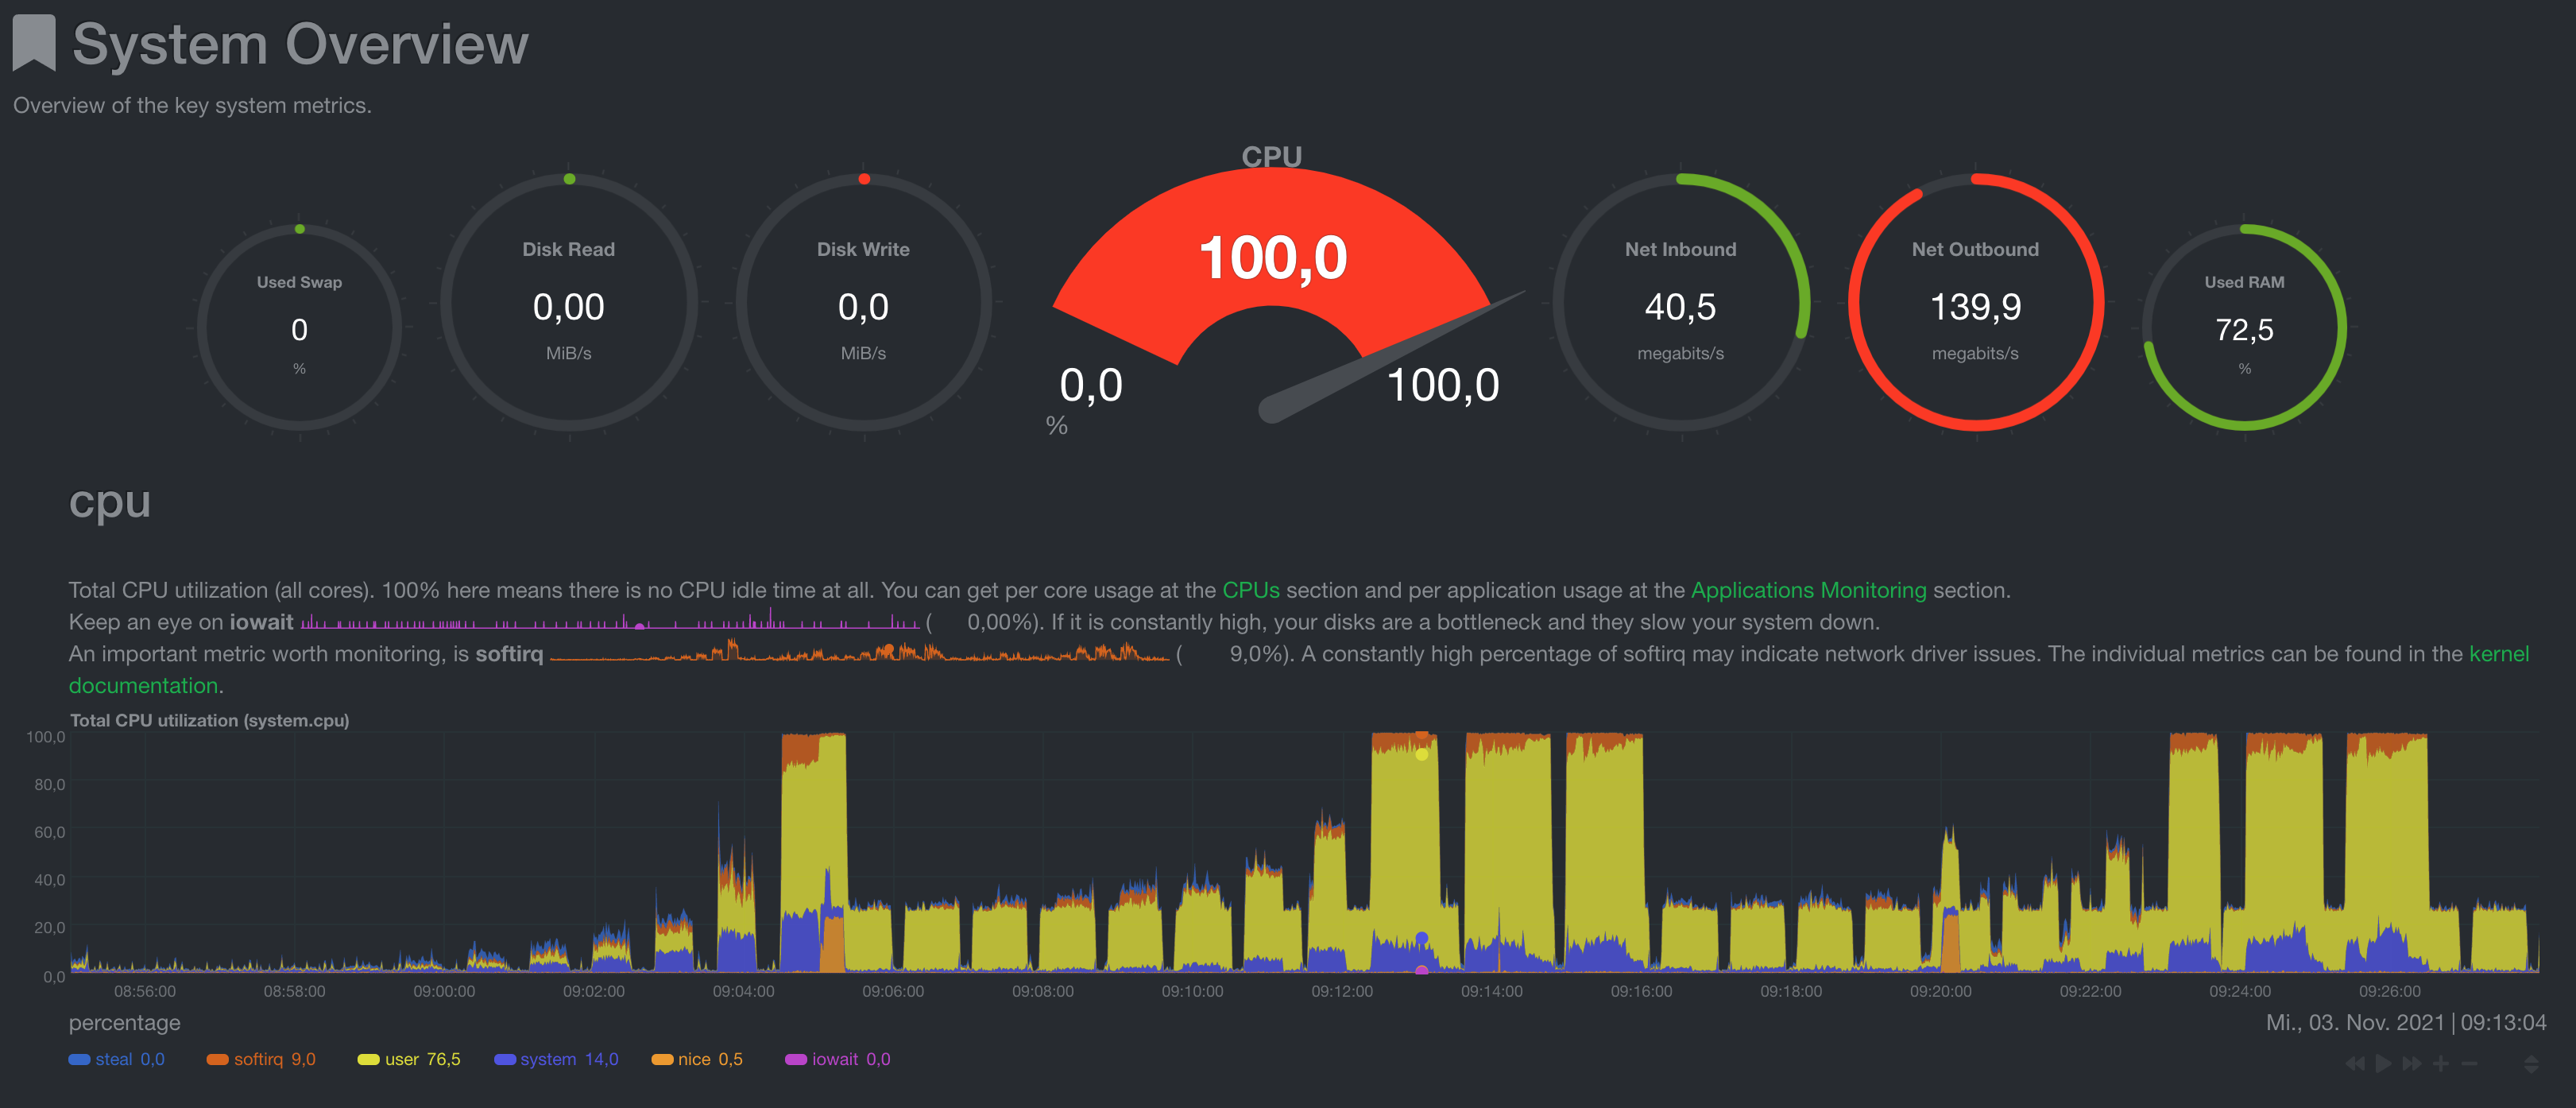 CPU is fully used, although a syslog process (blackbox) always failed and went out of control in the middle of the tests and consumed a full core consistently but with a high nice value so it is not thought to have influenced the test. Only a system reboot helped to resolve the broken blackbox process as it will restart once killed and get stuck again.
HAProxy CPU Load

At high number of requests or error rates, the load of the HAProxy process is quite substantial. There may be optimizations in HAProxy config possible here to improve overall performance of the API since it appears to be CPU limited. If less CPU were to be consumed by HAProxy in a high load scenario, this may free up CPU to increase the throughput of the Go process.
Go CPU Load
 At maximum, only 1-1.5 Cores are used. At high load HAProxy consumes the rest so 1.5-3 Cores.
RAM Usage

TCP Connections

DB connections and transactions per second
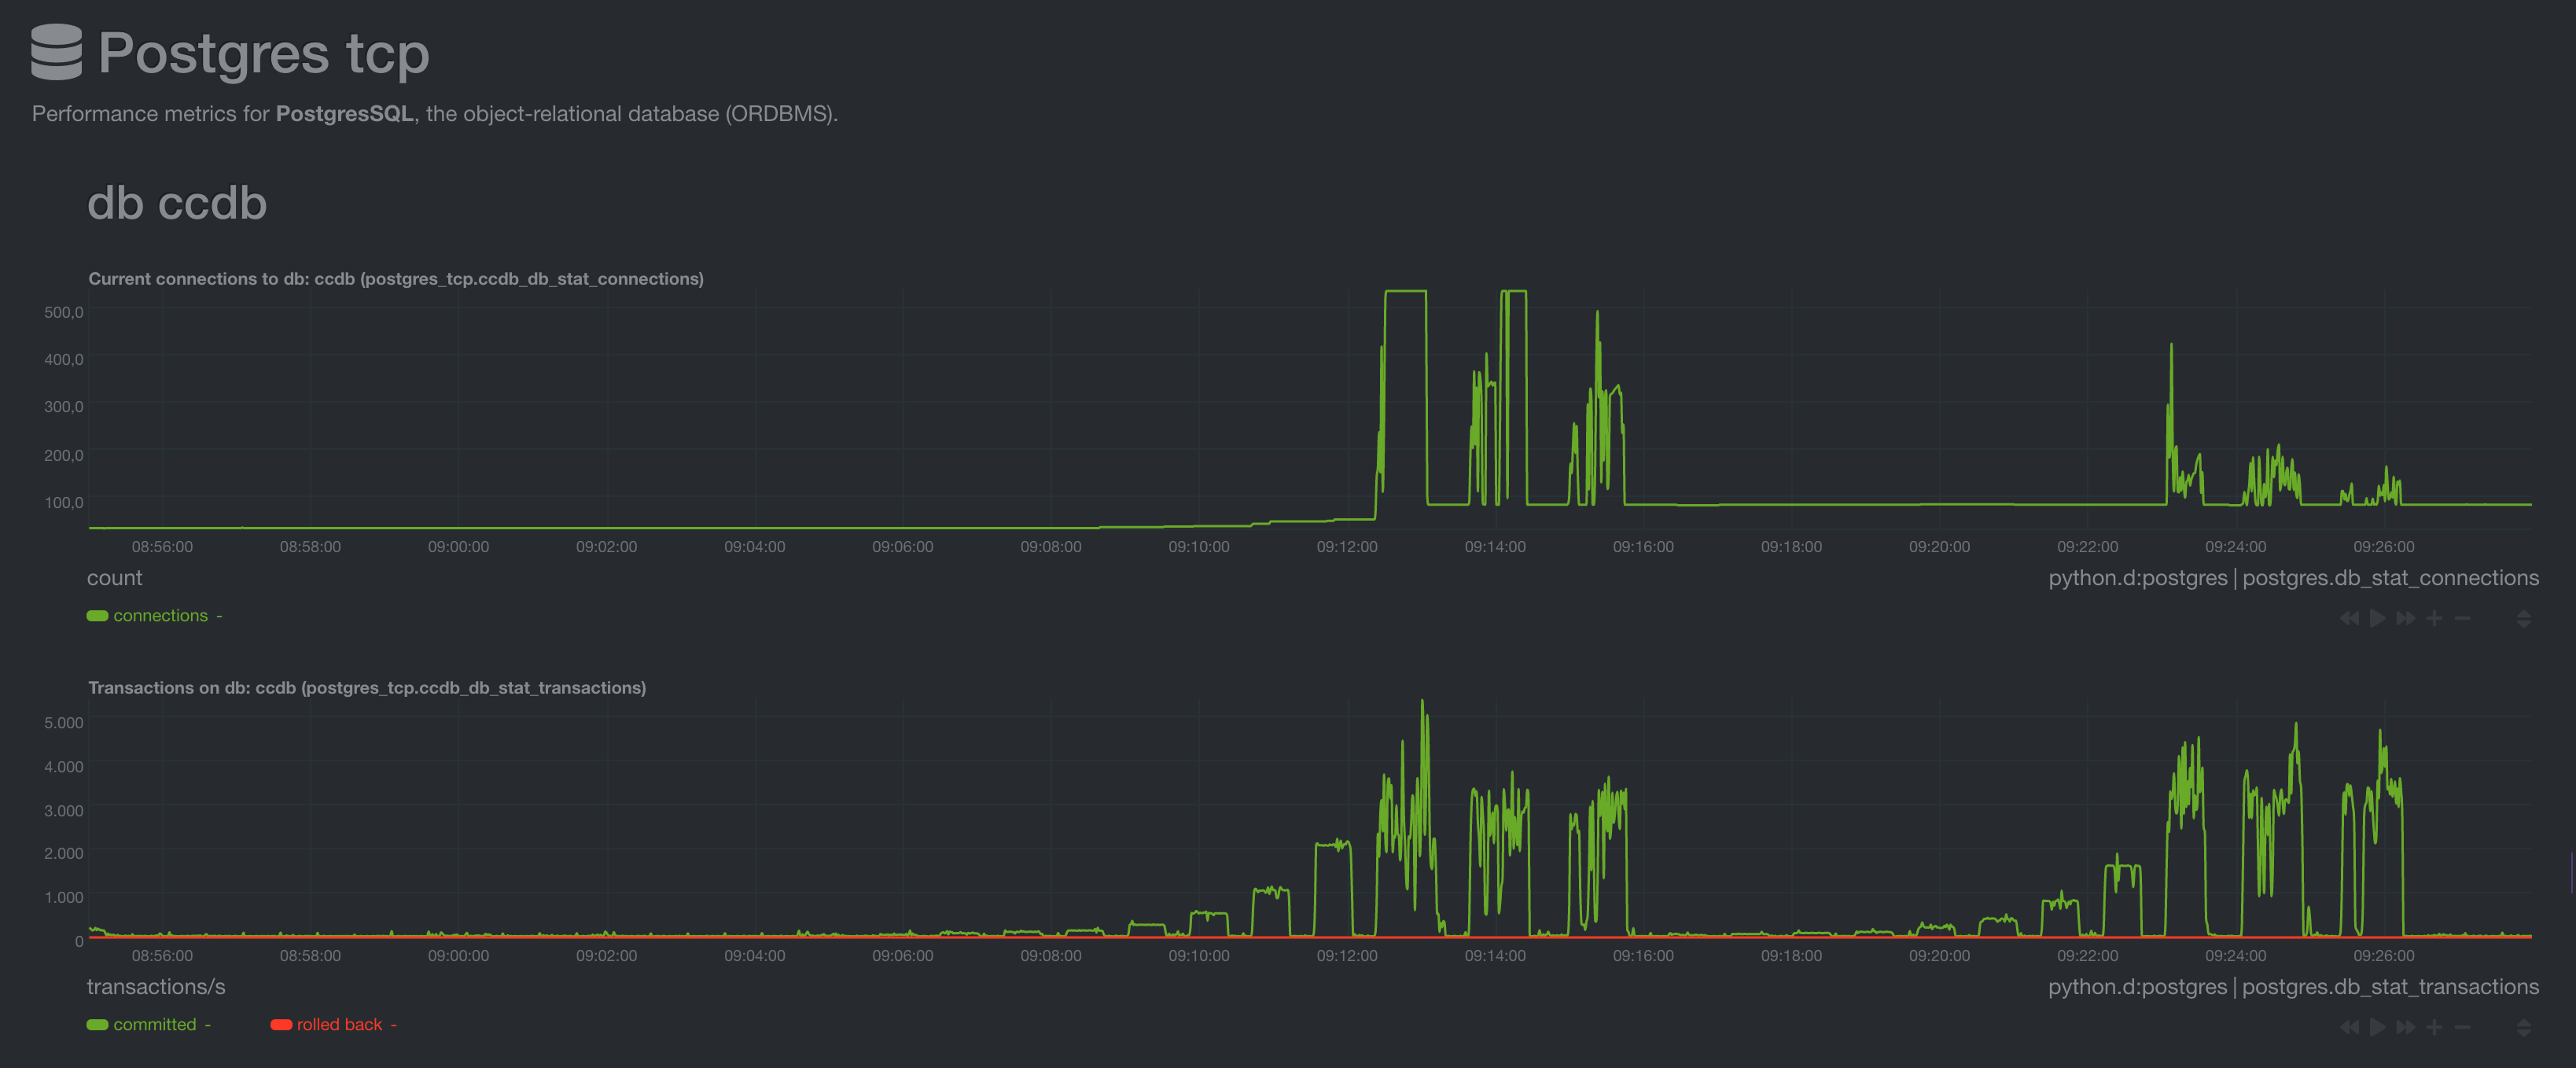 The DB connection pool is scaled up and down on demand. At maximum we observed around 5k transactions/s on the database. A more realistic peak load that is reached more consistently is around 3k-3.5k requests/s. As the Go implementation is designed to be the bottleneck and not the database, the transactions per second is not the maximum achievable for a single instance.
For this we conducted a second test with a single DB connection to get a estimate for how many API requests we could serve with the currently limiting factor of 5k available DB connections on AWS RDS PostgreSQL instances, provided that it can handle all of the transactions.
Ruby Implementation
To correlate the metrics to specific test runs, here are the timestamps of the test runs:
Targeting: https://10.0.65.66:9024/v3/info
2021-11-02 14:49:37.770203 - Using attack rate: 8 - {"body": "", "header": {"Authorization": "REDACTED"}, "method": "GET", "url": "https://10.0.65.66:9024/v3/info"}
2021-11-02 14:50:28.070121 - Using attack rate: 16 - {"body": "", "header": {"Authorization": "REDACTED"}, "method": "GET", "url": "https://10.0.65.66:9024/v3/info"}
2021-11-02 14:51:18.421874 - Using attack rate: 24 - {"body": "", "header": {"Authorization": "REDACTED"}, "method": "GET", "url": "https://10.0.65.66:9024/v3/info"}
2021-11-02 14:52:08.730871 - Using attack rate: 32 - {"body": "", "header": {"Authorization": "REDACTED"}, "method": "GET", "url": "https://10.0.65.66:9024/v3/info"}
2021-11-02 14:52:58.972751 - Using attack rate: 64 - {"body": "", "header": {"Authorization": "REDACTED"}, "method": "GET", "url": "https://10.0.65.66:9024/v3/info"}
2021-11-02 14:53:49.302106 - Using attack rate: 128 - {"body": "", "header": {"Authorization": "REDACTED"}, "method": "GET", "url": "https://10.0.65.66:9024/v3/info"}
2021-11-02 14:54:45.049050 - Using attack rate: 256 - {"body": "", "header": {"Authorization": "REDACTED"}, "method": "GET", "url": "https://10.0.65.66:9024/v3/info"}
2021-11-02 14:55:39.396009 - Using attack rate: 512 - {"body": "", "header": {"Authorization": "REDACTED"}, "method": "GET", "url": "https://10.0.65.66:9024/v3/info"}
2021-11-02 14:56:35.547554 - Using attack rate: 1024 - {"body": "", "header": {"Authorization": "REDACTED"}, "method": "GET", "url": "https://10.0.65.66:9024/v3/info"}
2021-11-02 14:57:25.914571 - Using attack rate: 2048 - {"body": "", "header": {"Authorization": "REDACTED"}, "method": "GET", "url": "https://10.0.65.66:9024/v3/info"}
2021-11-02 14:58:19.378228 - Using attack rate: 4096 - {"body": "", "header": {"Authorization": "REDACTED"}, "method": "GET", "url": "https://10.0.65.66:9024/v3/info"}


Targeting: https://10.0.65.66:9024/v3/buildpacks
2021-11-02 14:59:17.465476 - Using attack rate: 8 - {"body": "", "header": {"Authorization": "REDACTED"}, "method": "GET", "url": "https://10.0.65.66:9024/v3/buildpacks"}
2021-11-02 15:00:07.879977 - Using attack rate: 16 - {"body": "", "header": {"Authorization": "REDACTED"}, "method": "GET", "url": "https://10.0.65.66:9024/v3/buildpacks"}
2021-11-02 15:00:58.330487 - Using attack rate: 24 - {"body": "", "header": {"Authorization": "REDACTED"}, "method": "GET", "url": "https://10.0.65.66:9024/v3/buildpacks"}
2021-11-02 15:01:48.664109 - Using attack rate: 32 - {"body": "", "header": {"Authorization": "REDACTED"}, "method": "GET", "url": "https://10.0.65.66:9024/v3/buildpacks"}
2021-11-02 15:02:45.669107 - Using attack rate: 64 - {"body": "", "header": {"Authorization": "REDACTED"}, "method": "GET", "url": "https://10.0.65.66:9024/v3/buildpacks"}
2021-11-02 15:03:42.210203 - Using attack rate: 128 - {"body": "", "header": {"Authorization": "REDACTED"}, "method": "GET", "url": "https://10.0.65.66:9024/v3/buildpacks"}
2021-11-02 15:04:51.524479 - Using attack rate: 256 - {"body": "", "header": {"Authorization": "REDACTED"}, "method": "GET", "url": "https://10.0.65.66:9024/v3/buildpacks"}
2021-11-02 15:05:42.108656 - Using attack rate: 512 - {"body": "", "header": {"Authorization": "REDACTED"}, "method": "GET", "url": "https://10.0.65.66:9024/v3/buildpacks"}
2021-11-02 15:07:12.638379 - Using attack rate: 1024 - {"body": "", "header": {"Authorization": "REDACTED"}, "method": "GET", "url": "https://10.0.65.66:9024/v3/buildpacks"}
2021-11-02 15:09:04.571407 - Using attack rate: 2048 - {"body": "", "header": {"Authorization": "REDACTED"}, "method": "GET", "url": "https://10.0.65.66:9024/v3/buildpacks"}
2021-11-02 15:10:19.833107 - Using attack rate: 4096 - {"body": "", "header": {"Authorization": "REDACTED"}, "method": "GET", "url": "https://10.0.65.66:9024/v3/buildpacks"}


Targeting: https://10.0.65.66:9024/v3/security_groups
2021-11-02 15:11:33.580214 - Using attack rate: 8 - {"body": "", "header": {"Authorization": "REDACTED"}, "method": "GET", "url": "https://10.0.65.66:9024/v3/security_groups/619fb6a8-038c-4934-9285-1c2793cb3b1c"}
2021-11-02 15:12:24.311953 - Using attack rate: 16 - {"body": "", "header": {"Authorization": "REDACTED"}, "method": "GET", "url": "https://10.0.65.66:9024/v3/security_groups/619fb6a8-038c-4934-9285-1c2793cb3b1c"}
2021-11-02 15:13:14.636080 - Using attack rate: 24 - {"body": "", "header": {"Authorization": "REDACTED"}, "method": "GET", "url": "https://10.0.65.66:9024/v3/security_groups/619fb6a8-038c-4934-9285-1c2793cb3b1c"}
2021-11-02 15:14:05.095217 - Using attack rate: 32 - {"body": "", "header": {"Authorization": "REDACTED"}, "method": "GET", "url": "https://10.0.65.66:9024/v3/security_groups/619fb6a8-038c-4934-9285-1c2793cb3b1c"}
2021-11-02 15:14:55.409231 - Using attack rate: 64 - {"body": "", "header": {"Authorization": "REDACTED"}, "method": "GET", "url": "https://10.0.65.66:9024/v3/security_groups/619fb6a8-038c-4934-9285-1c2793cb3b1c"}
2021-11-02 15:15:55.436128 - Using attack rate: 128 - {"body": "", "header": {"Authorization": "REDACTED"}, "method": "GET", "url": "https://10.0.65.66:9024/v3/security_groups/619fb6a8-038c-4934-9285-1c2793cb3b1c"}
2021-11-02 15:16:57.788453 - Using attack rate: 256 - {"body": "", "header": {"Authorization": "REDACTED"}, "method": "GET", "url": "https://10.0.65.66:9024/v3/security_groups/619fb6a8-038c-4934-9285-1c2793cb3b1c"}
2021-11-02 15:17:54.845722 - Using attack rate: 512 - {"body": "", "header": {"Authorization": "REDACTED"}, "method": "GET", "url": "https://10.0.65.66:9024/v3/security_groups/619fb6a8-038c-4934-9285-1c2793cb3b1c"}
2021-11-02 15:19:05.253594 - Using attack rate: 1024 - {"body": "", "header": {"Authorization": "REDACTED"}, "method": "GET", "url": "https://10.0.65.66:9024/v3/security_groups/619fb6a8-038c-4934-9285-1c2793cb3b1c"}
2021-11-02 15:20:11.579831 - Using attack rate: 2048 - {"body": "", "header": {"Authorization": "REDACTED"}, "method": "GET", "url": "https://10.0.65.66:9024/v3/security_groups/619fb6a8-038c-4934-9285-1c2793cb3b1c"}
2021-11-02 15:21:24.921151 - Using attack rate: 4096 - {"body": "", "header": {"Authorization": "REDACTED"}, "method": "GET", "url": "https://10.0.65.66:9024/v3/security_groups/619fb6a8-038c-4934-9285-1c2793cb3b1c"}
CPU Load
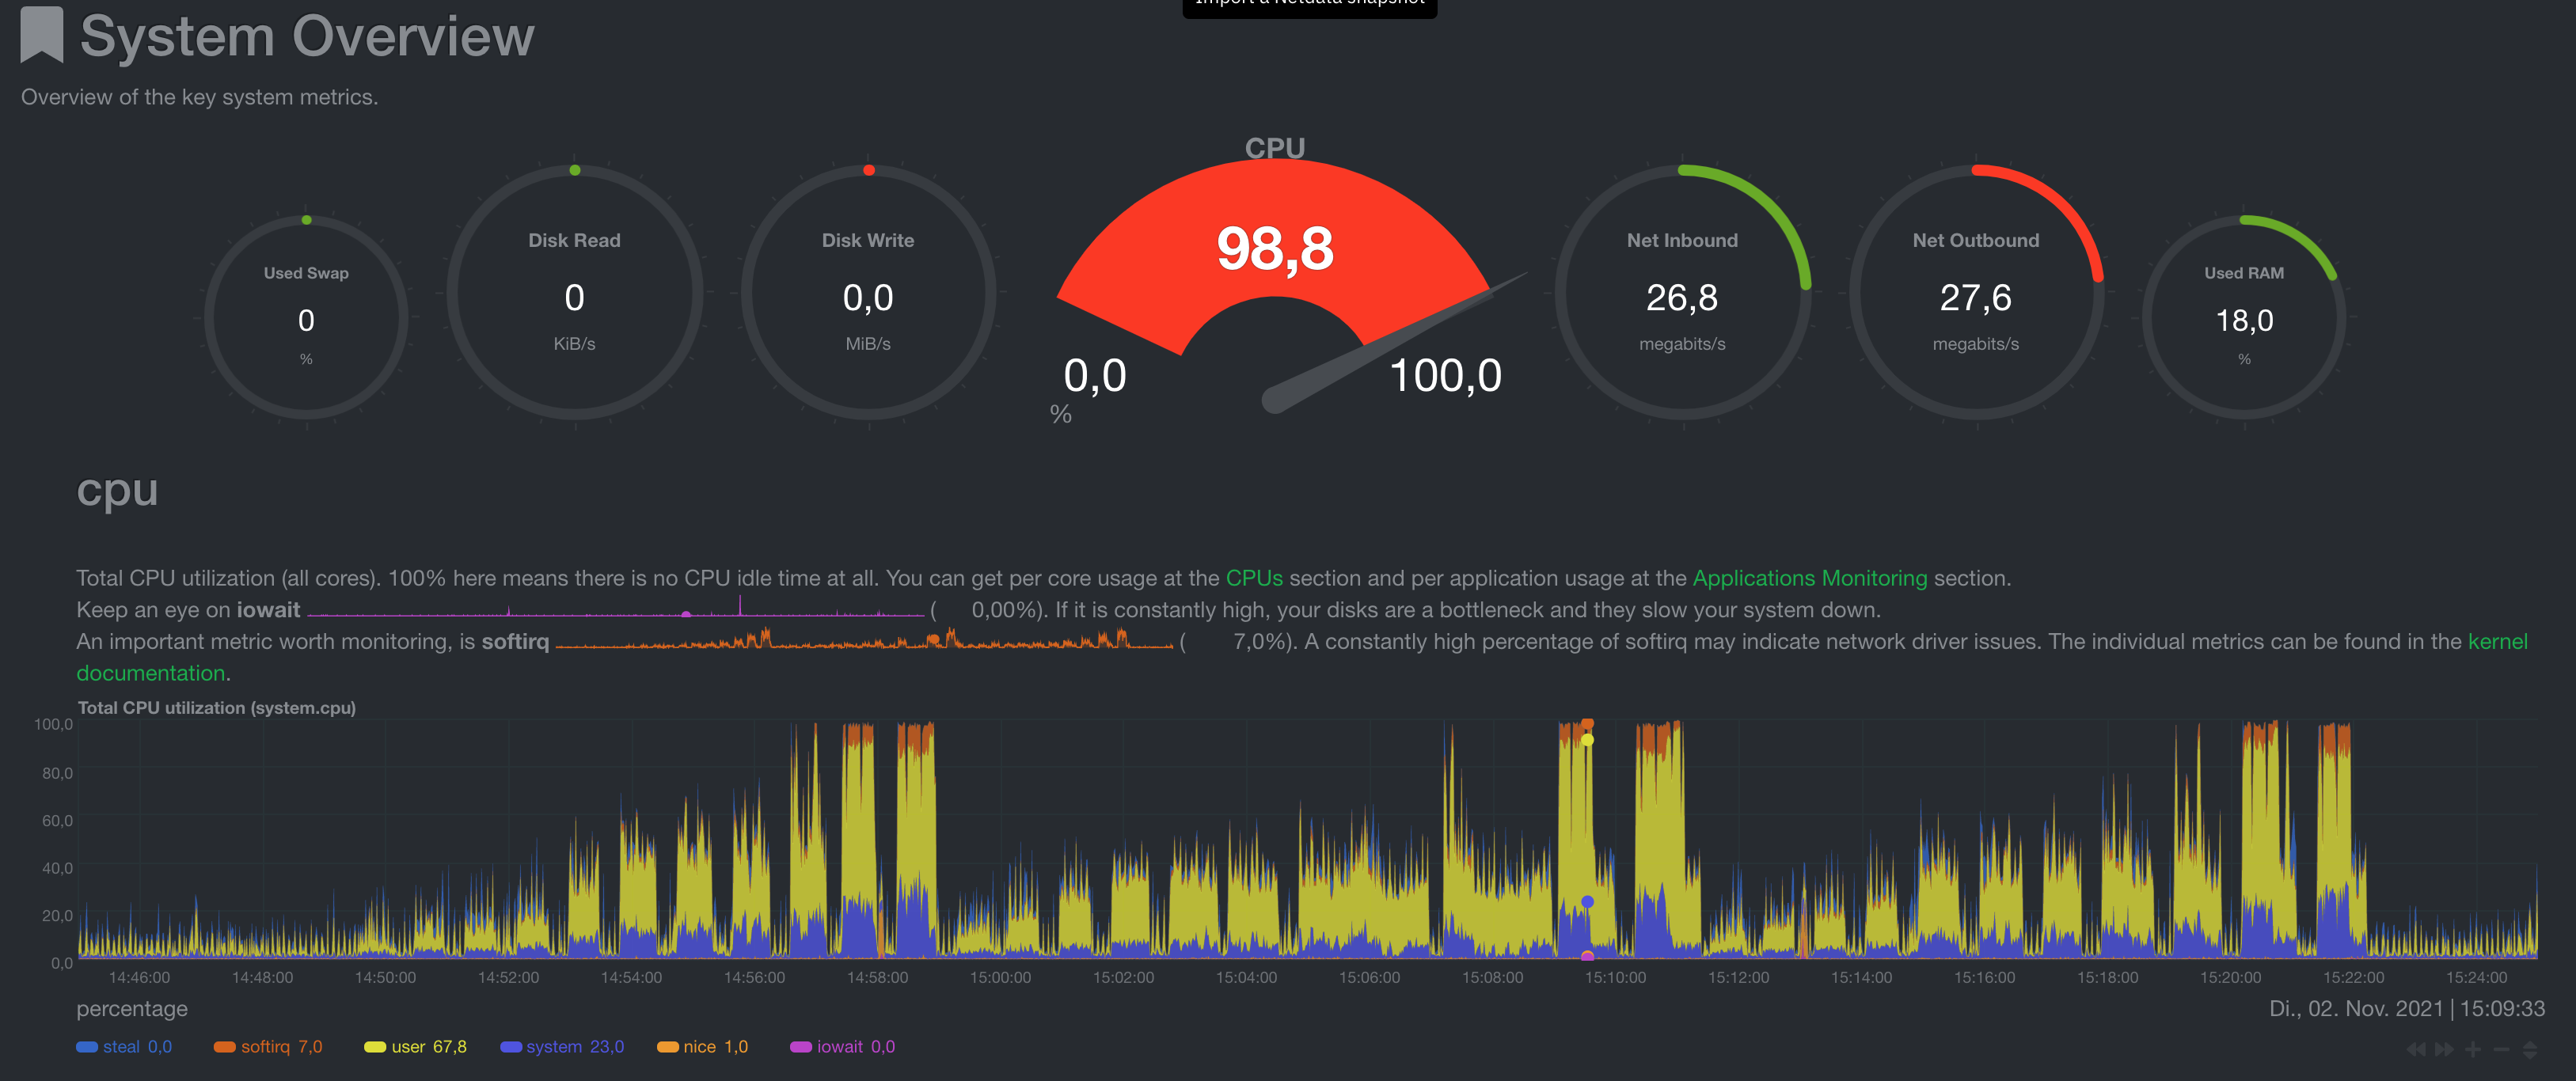 The CPU load is a lot more spiky and even when the API responds with failures, not all resources are used.
Nginx Load
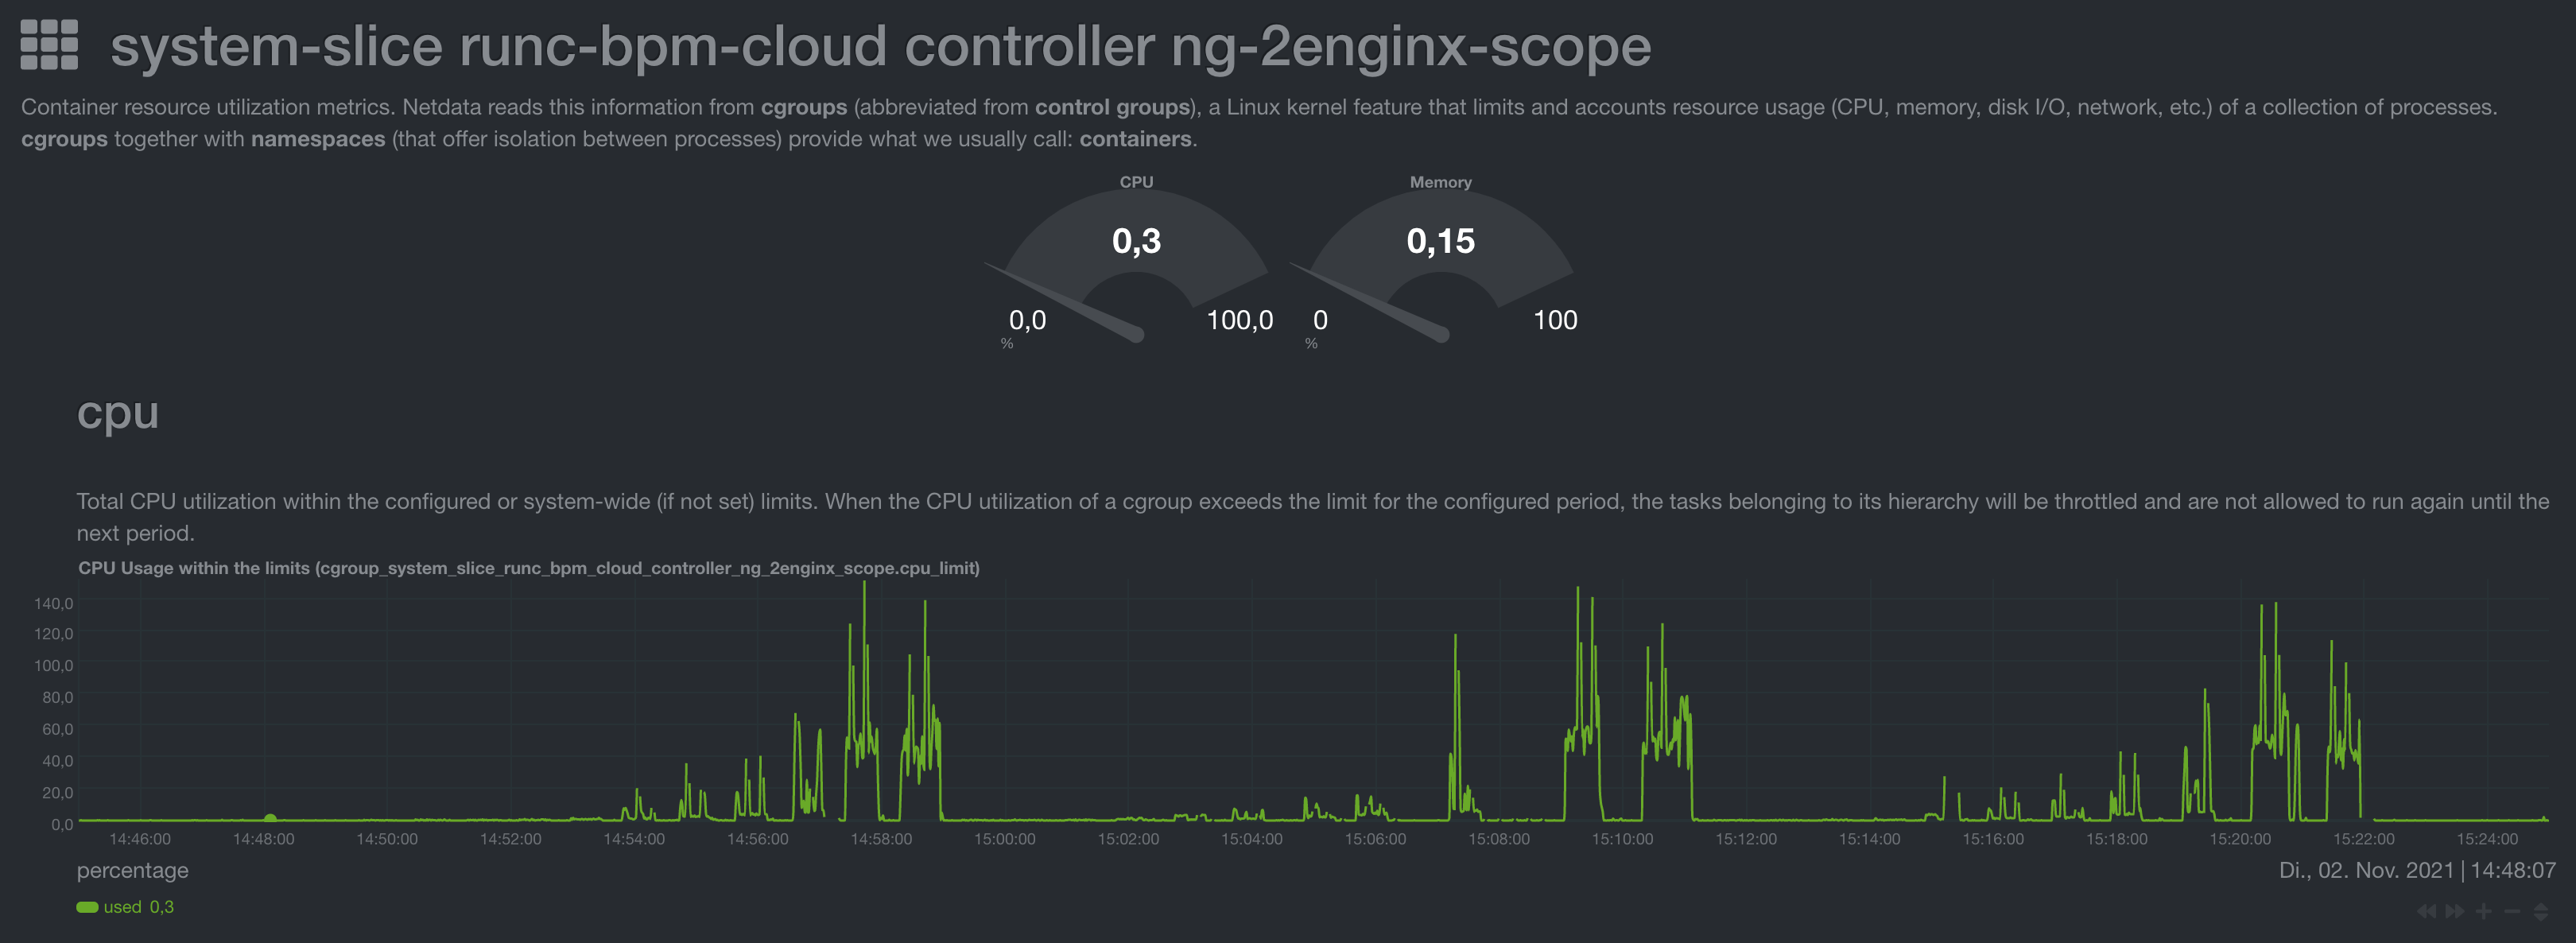 At high loads nginx consumes a full core which is still a lot less than HAproxy did.
CloudController Load
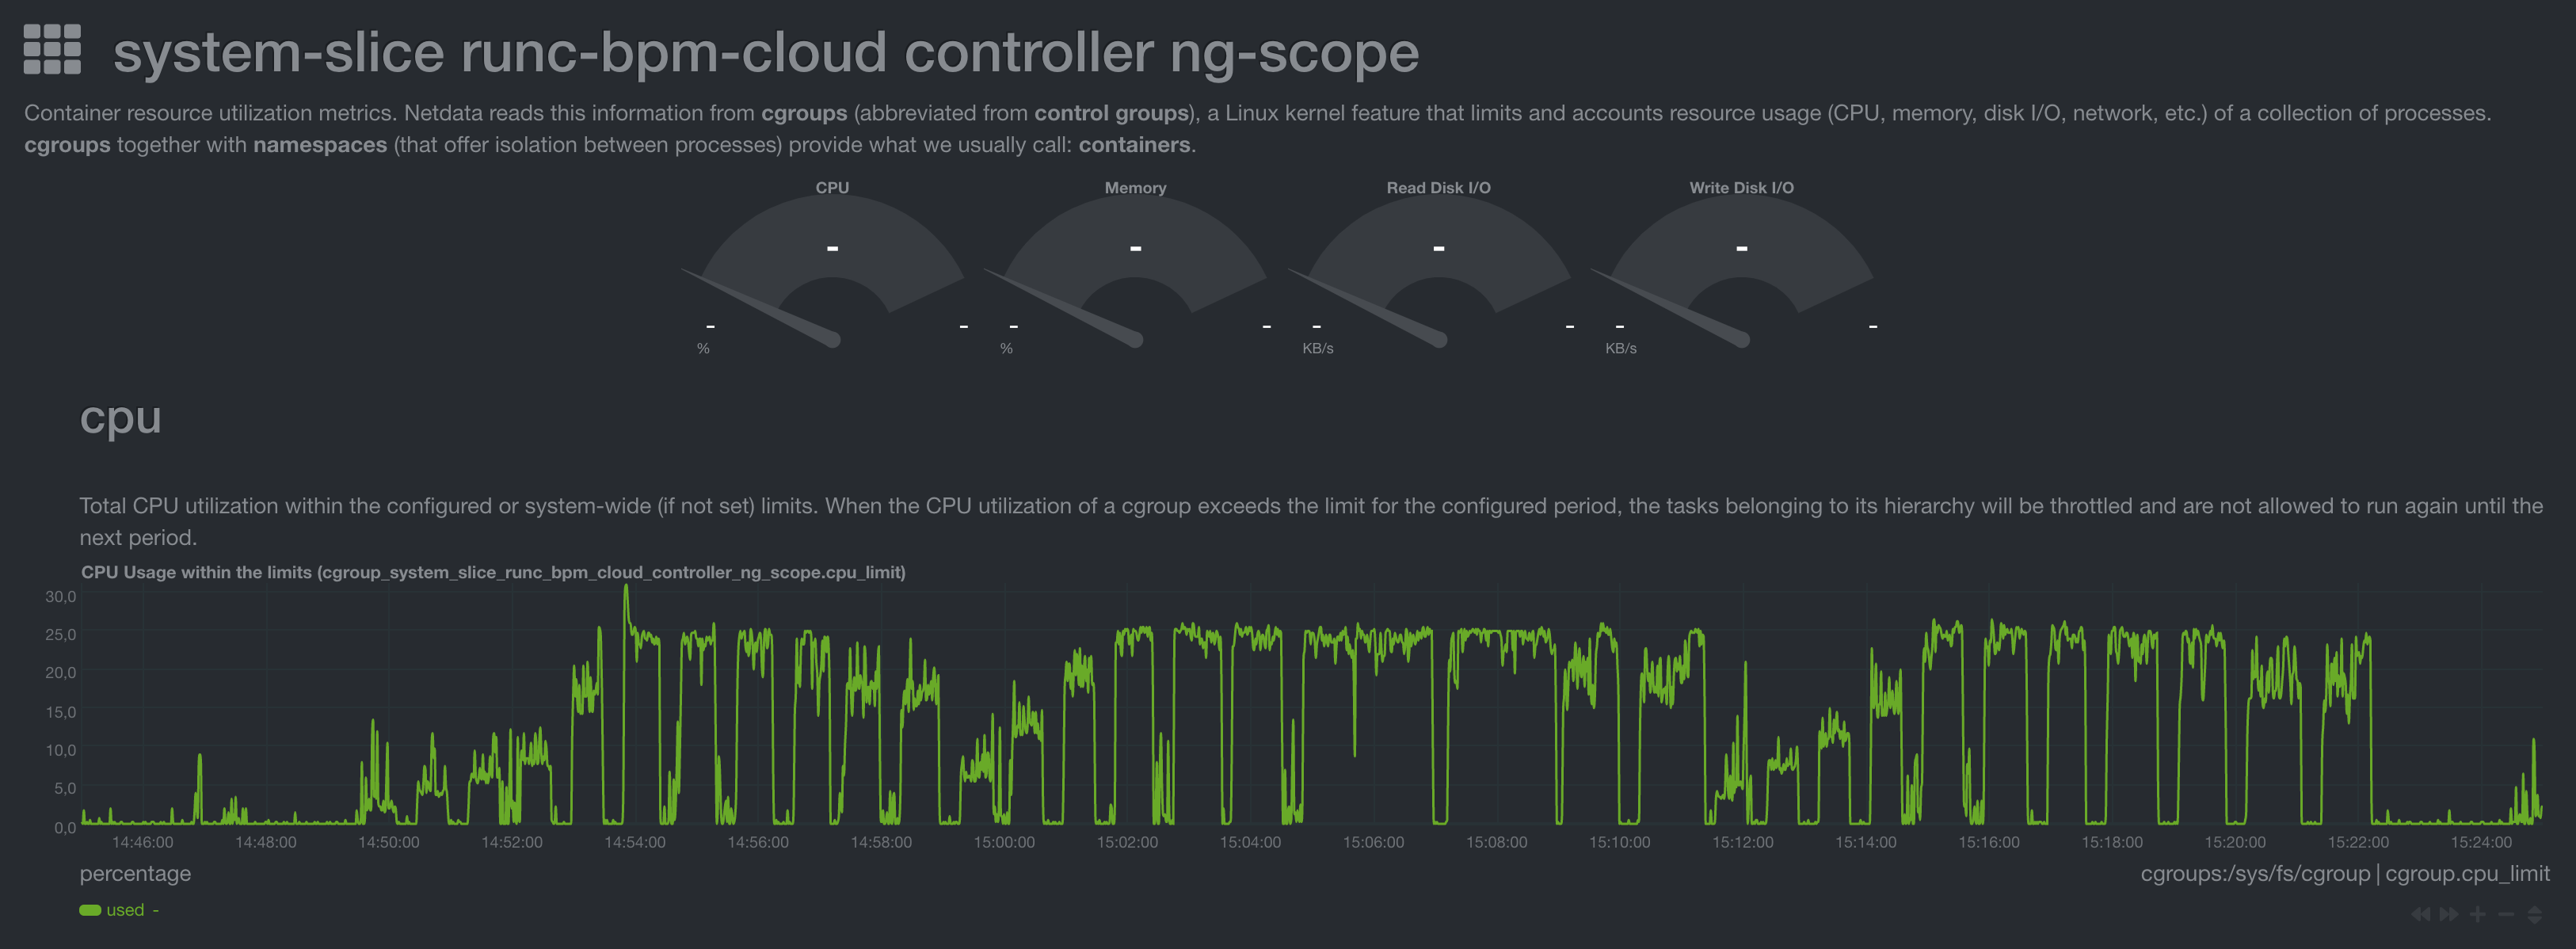 In this graph it is clear that the real resource limitation is Ruby's single threaded interpreter. Using a full core is the limit of a single Ruby process and once hit the API responds with failures or fails to answer requests.
RAM Usage

TCP Connections

DB connections and transactions per second
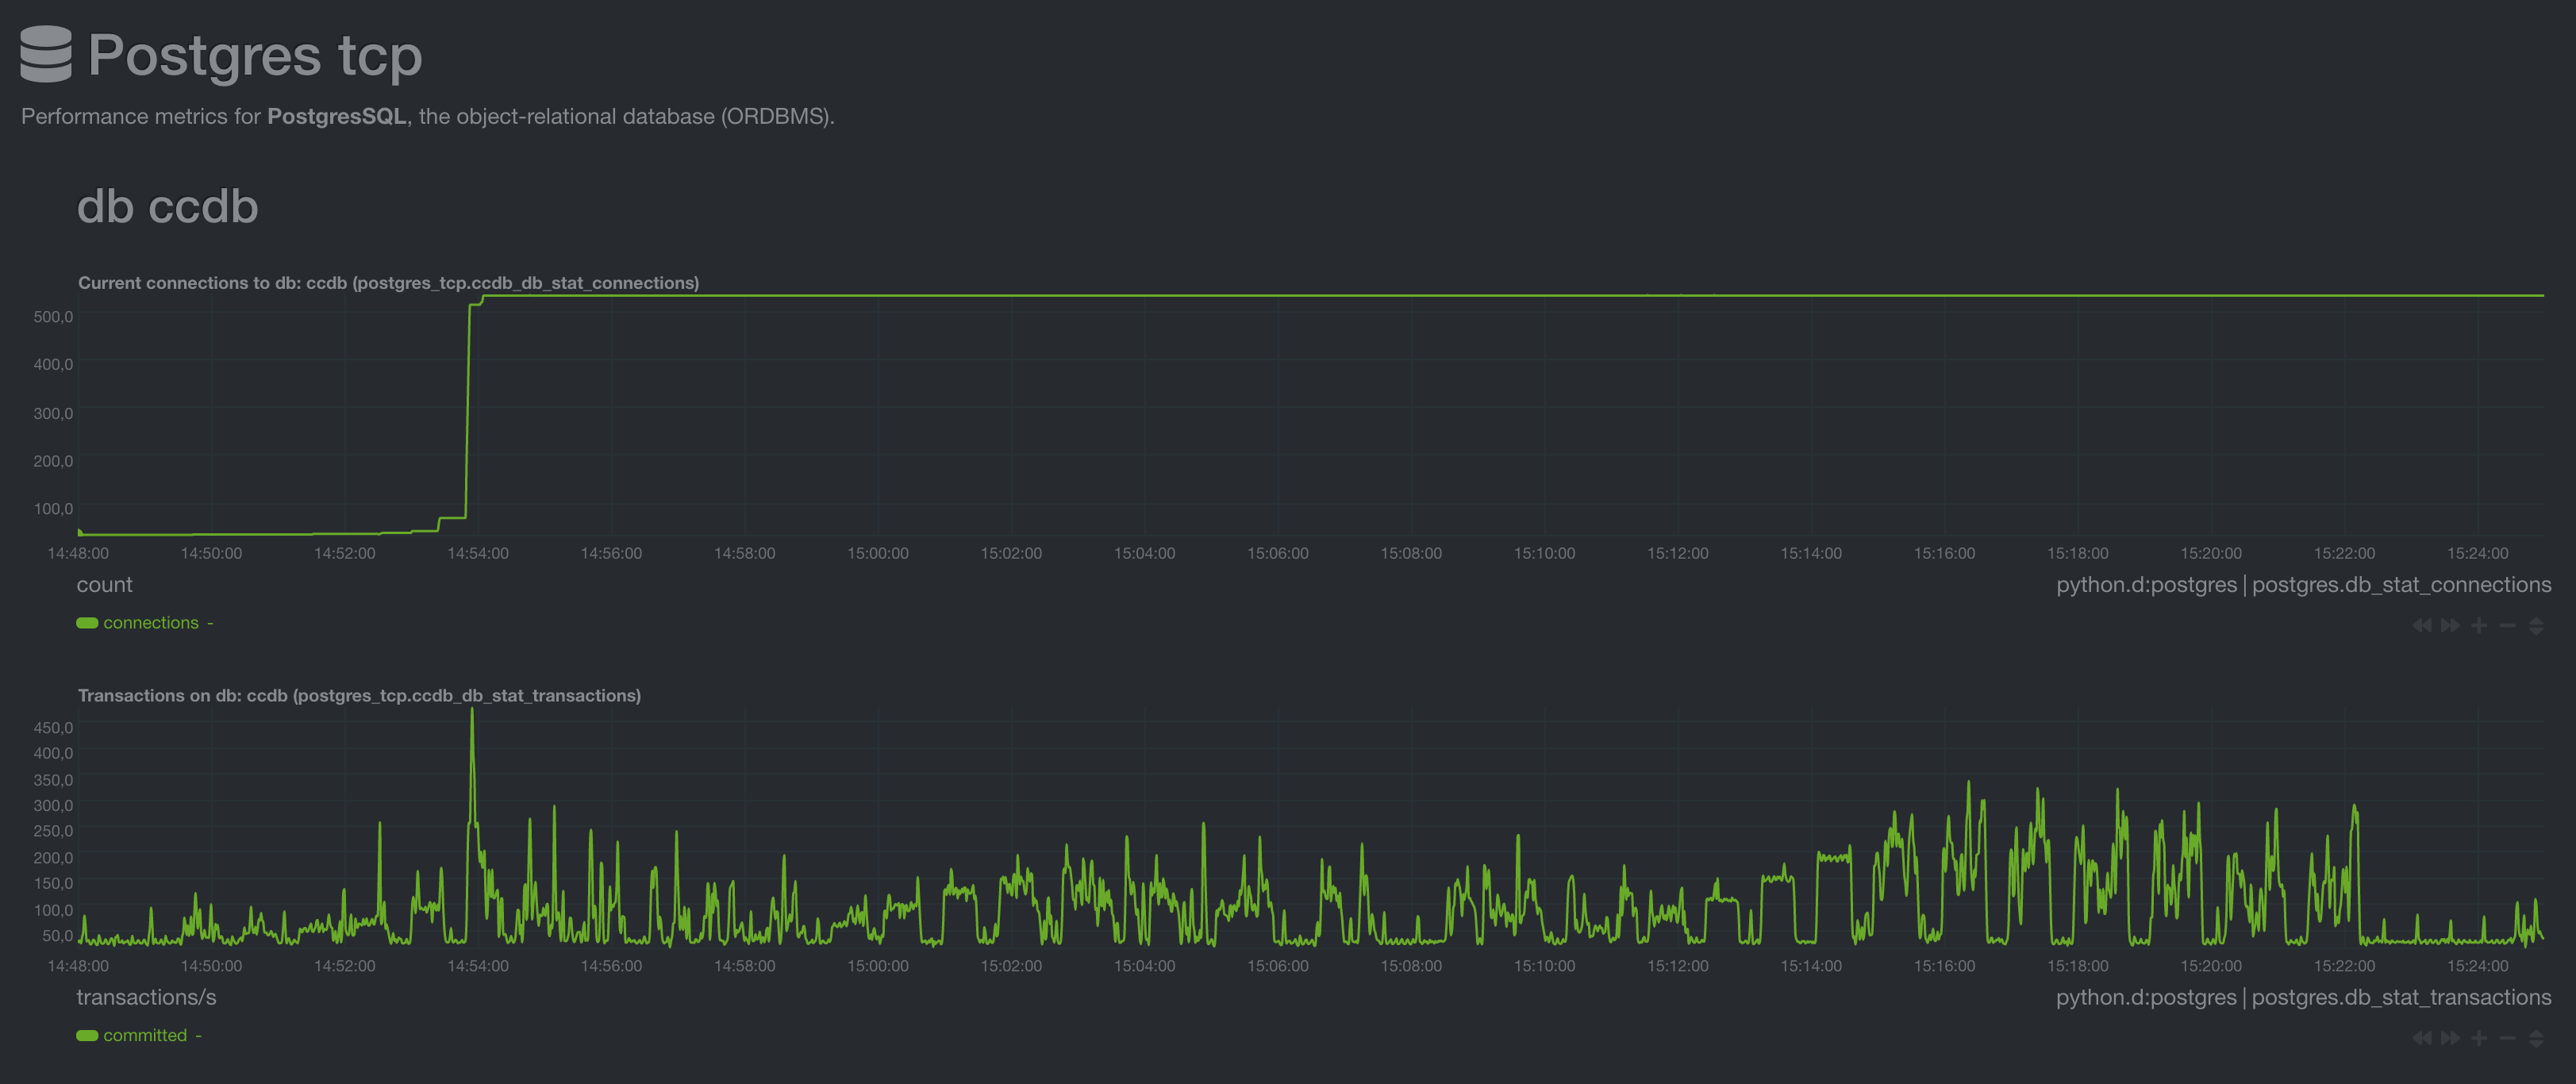 The DB connection pool is only ever scaled up and never down again. Connections would get closed once they time out after an hour but this was beyond the limit of these tests. At maximum we observed around 450 transactions/s on the database, whilst a more realistic peak load that is reached more consistently is around 300-350 requests/s.
Summary
Maximum requests per second on this test setup
| Endpoint | Go Implementation | Ruby Implementation | Improvement |
| /v3/info | 4000 | 100 | +3900%(40 Times more) |
| /v3/buildpacks | 550 | 30 | +1730%(18.3 Times more) |
| /v3/security_groups/:guid | 750 | 40 | +1775%(18.75 Times more) |
Further Findings
- The Go implementation can issue 10x more transactions per second (operations on the database) using the same number of DB connections. Potentially, this number could be even higher but given the Go implementation performs fewer DB transactions per API request, this would likely become CPU bound before being limited by DB connections. The Ruby implementation on the other hand has also some room for improvement that could be made e.g. by improving how role checking is done as this could be performed with fewer queries. This test only serves to compare the current state.
- The Go implementation does not get pulled out of load balancing in an overload situation
- The Go implementation may be wasting a lot of resources in HAProxy that could be looked at and tweaked or behaviour (TLS termination etc.) moved directly into the Go codebase
- The Go implementation uses more RAM in general and it increases/decreases more on peak loads, but this is to be expected since it handles up to 40 times more requests
We also briefly tested the Go implementation on a large VM (64 cores) to see how it would scale vertically. We saw 30k+ /v3/info calls per second being handled by a single instance. At that point the emitter of the requests could no longer keep up and a distributed load test would be needed to see real results.
Since this would be time consuming and not comparable against a single threaded implementation we did not pursue this test further.
Raw Measurements
All measurement runs can be found in below table. At the bottom of each column is a download link for all raw measurements in a tar.xz file. A guide for looking at the raw values is can be found in viewing raw results
Go - Test single db connection
This second test is not aimed at comparing against the cloud_controller_ng Ruby implementation - instead it is meant to show how many transactions can be issued to the database over a single connection.
This is important as currently a hard limit is set for e.g. AWS RDS instances. The biggest RDS instance can handle just 5k open connections LEAST({DBInstanceClassMemory/9531392}, 5000).
So when doing e.g. 30 /v3/buildpacks requests per second over 190 cloud_controller_ng instances (maximum number of instances on 5000 DB connections using the default DB connection pool) we can just squeeze out 5.7k requests per second under absolutely optimal conditions (the DB responding as if it was not under load). This is currently a limiting factor for horizontally scaling cloud_controller_ng. In reality we already see issues around 800-1000 requests per second arising when using 150 cloud_controller_ng instances (based on real load distribution with a large production databases).
With this test we aim to see how many requests per second and DB transactions could theoretically be served by the Go implementation with 5000 connections and if this number is still a hard limit for the horizontal scaling of the Go implementation.
Test setup
The setup was the same as in the first test run.
However the the maximum amount of usable DB connections was set to 1.
Additionally just the Go implementation was tested.
/v3/info
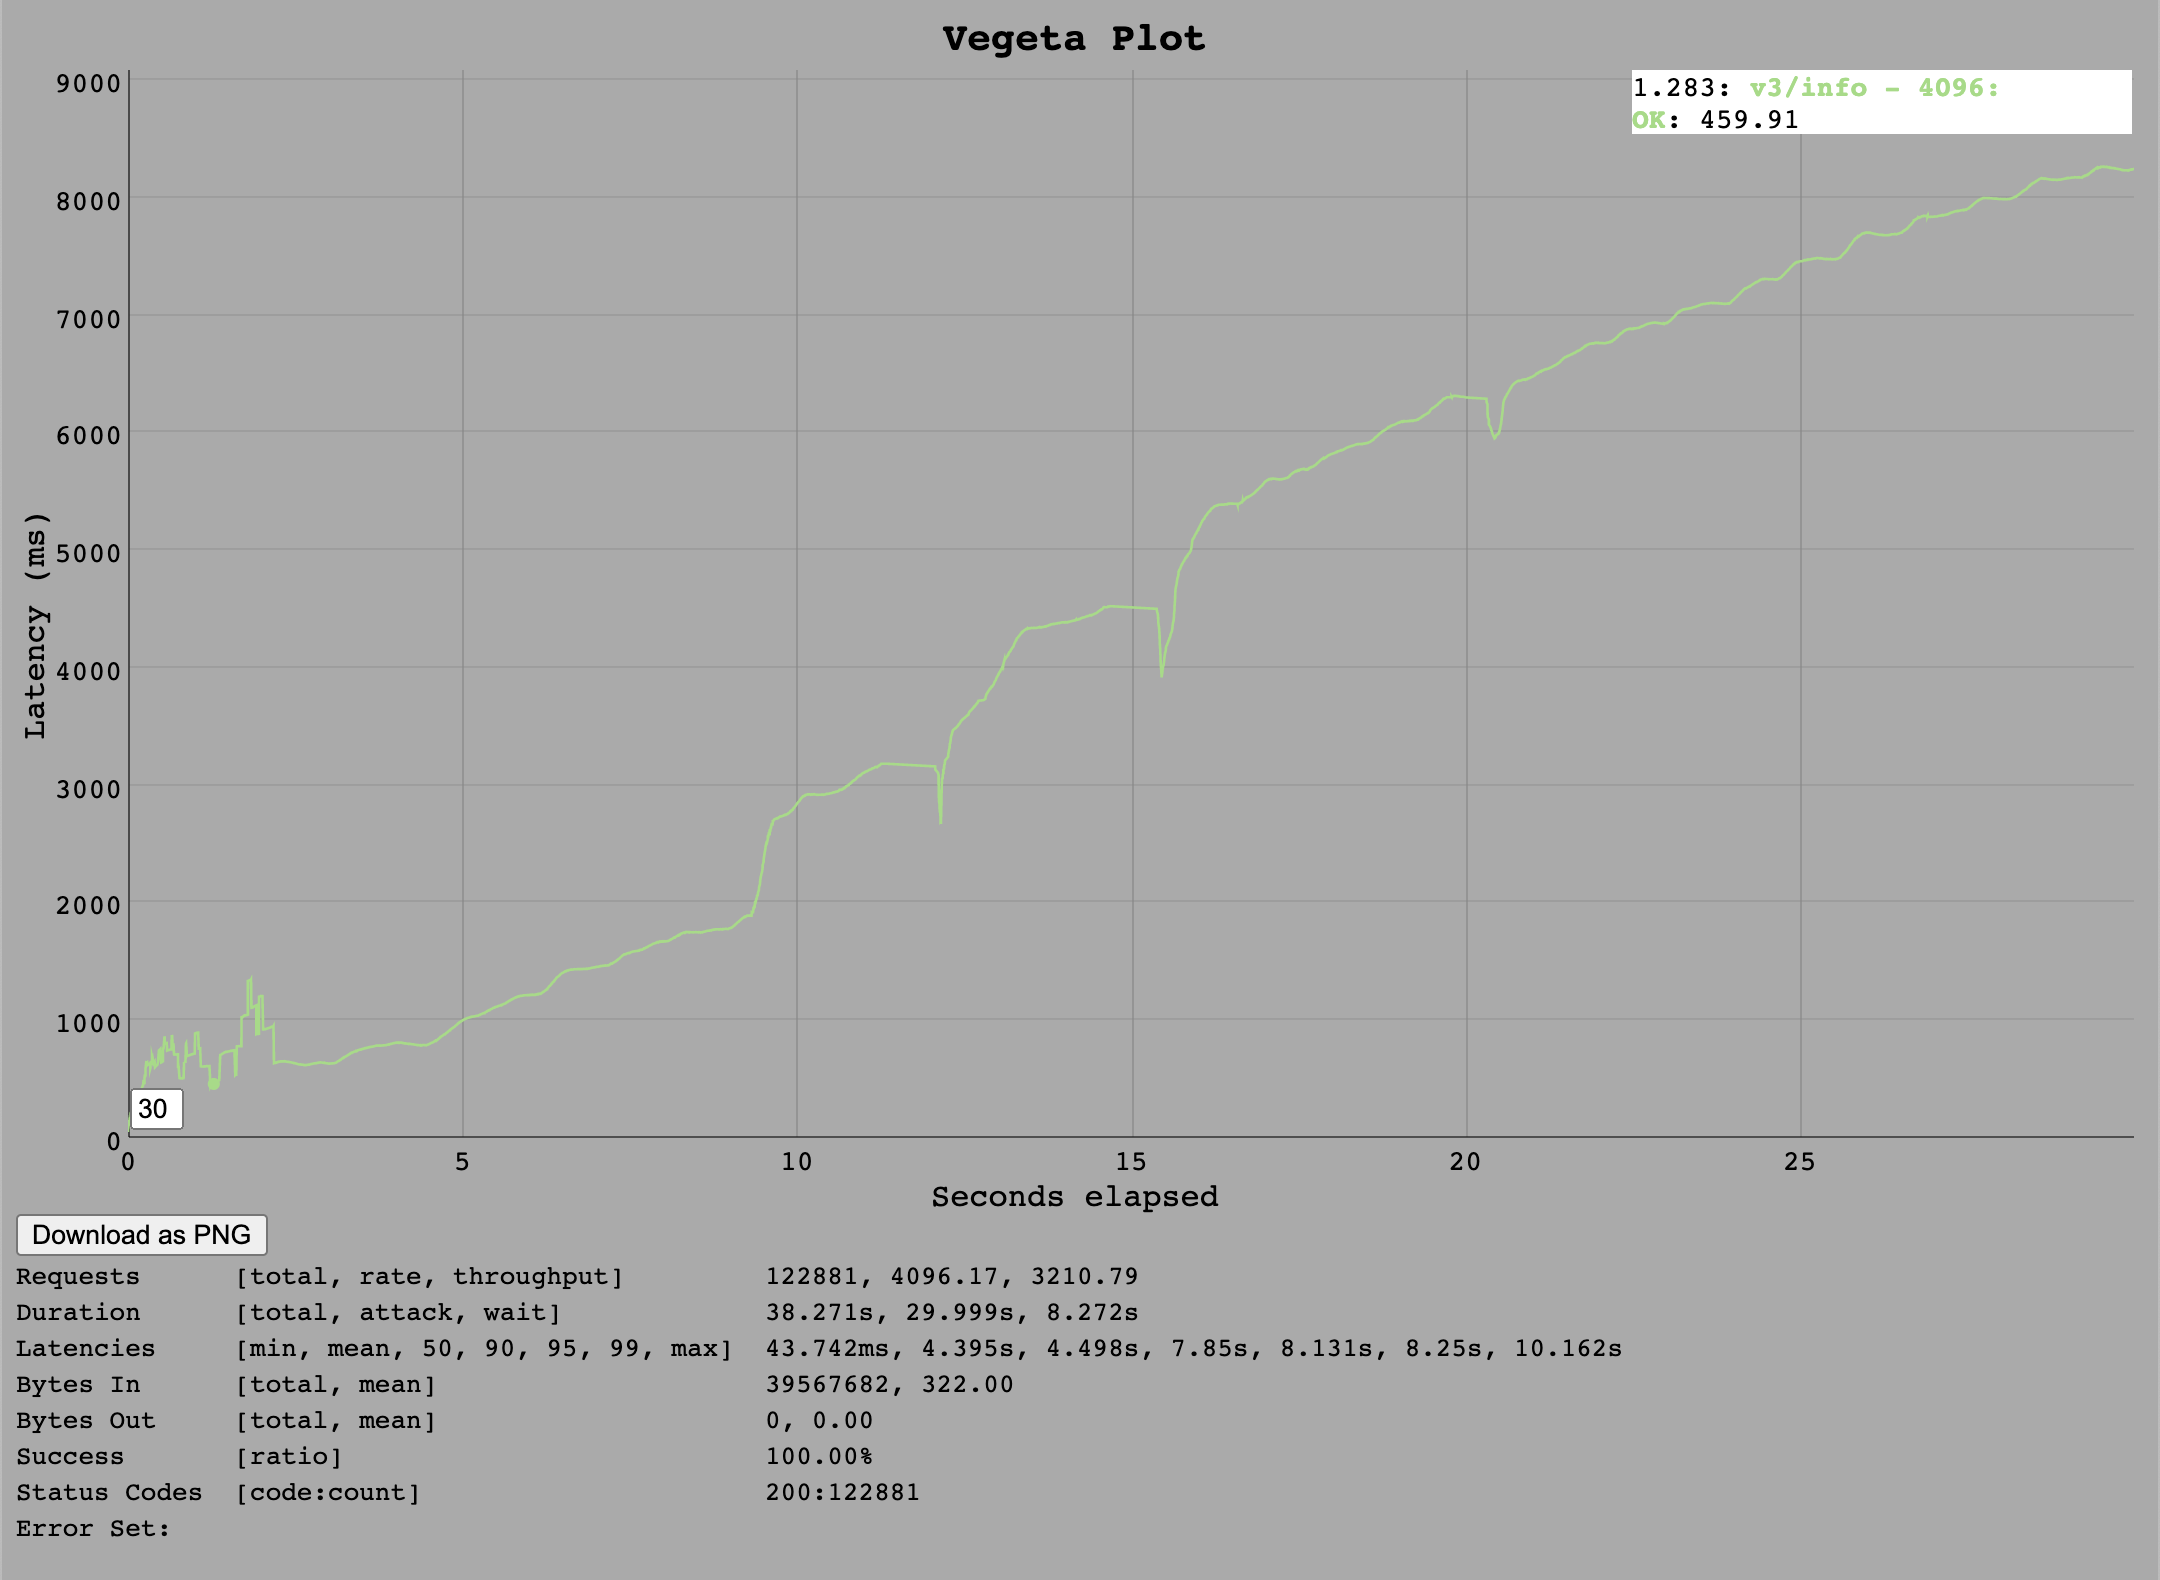
With a single DB Connection, the performance of the /v3/info is expected to be unchanged from the first test.
However, we observe fewer requests per second were handled - this is likely related to VM burst budgets.
Ideally these tests should have been conducted on non-burstable instance types and these may be repeated later but for now they are kept as they are to serve as at least a rough comparison.
/v3/buildpacks
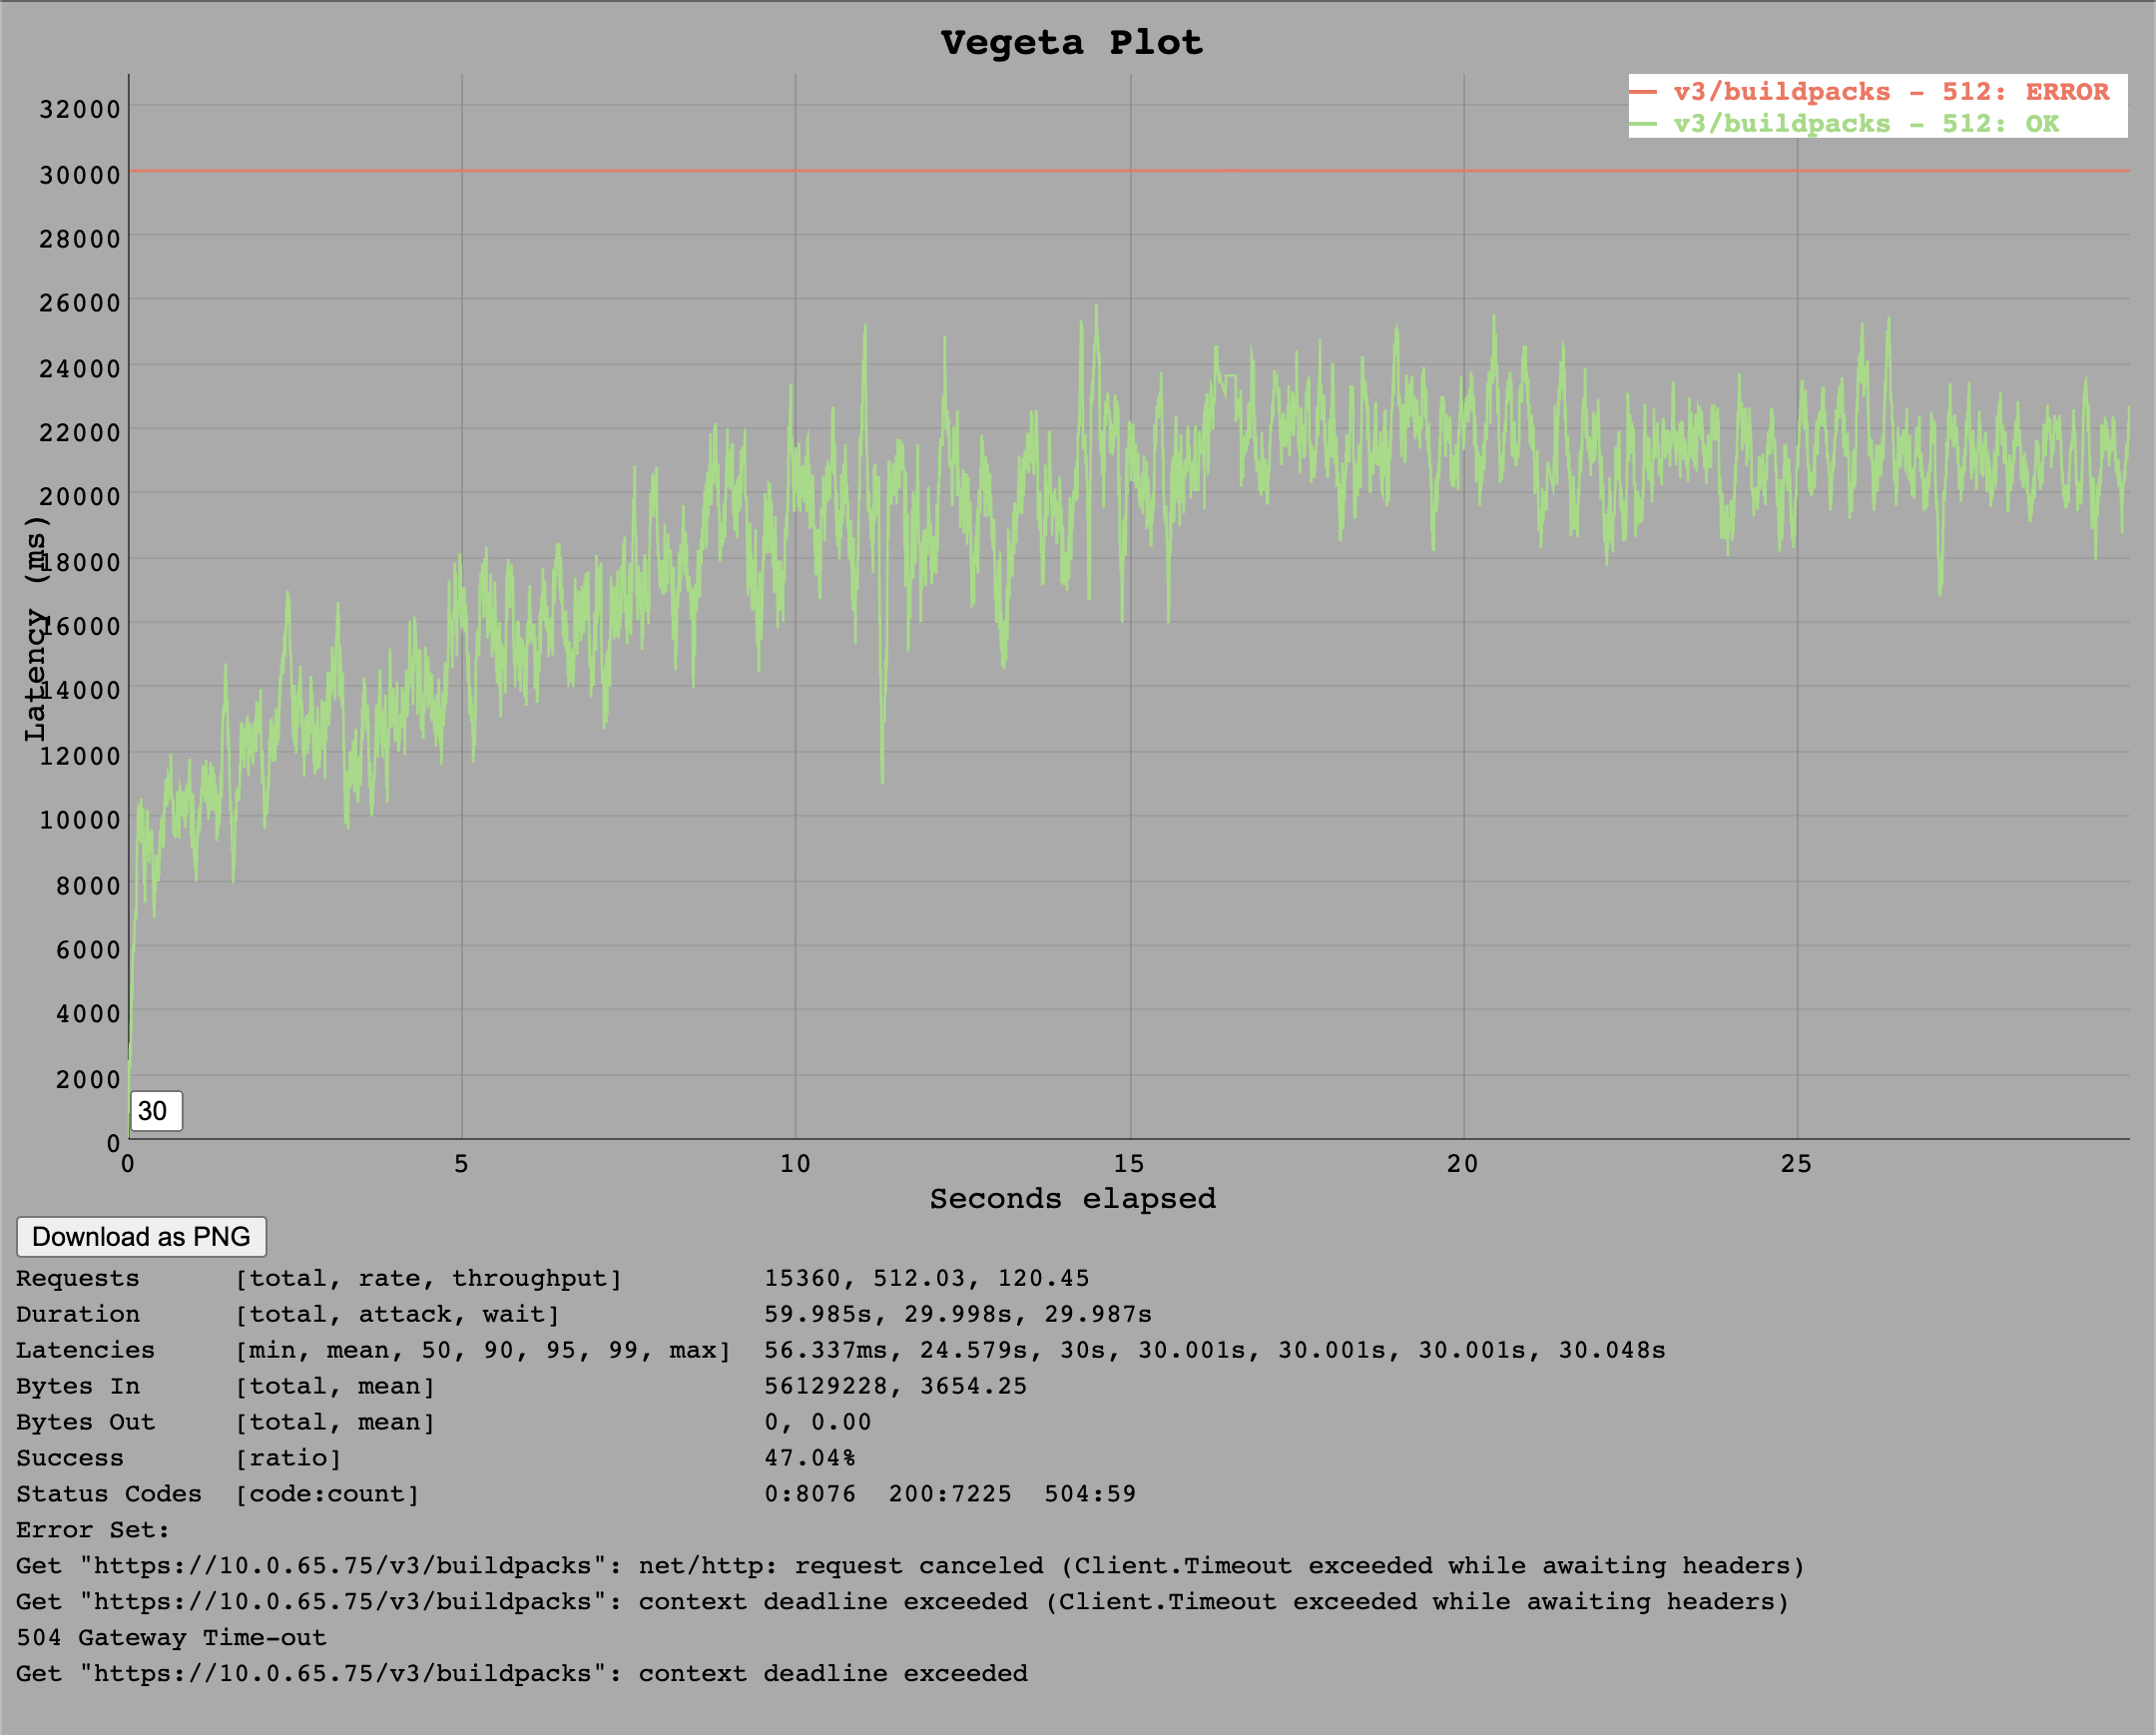
The buildpacks endpoint can now only handle around 250 requests per second which produces roughly 1k transactions per second on the database. This indicates that the single DB connection is being fully utilised and has become the bottleneck.
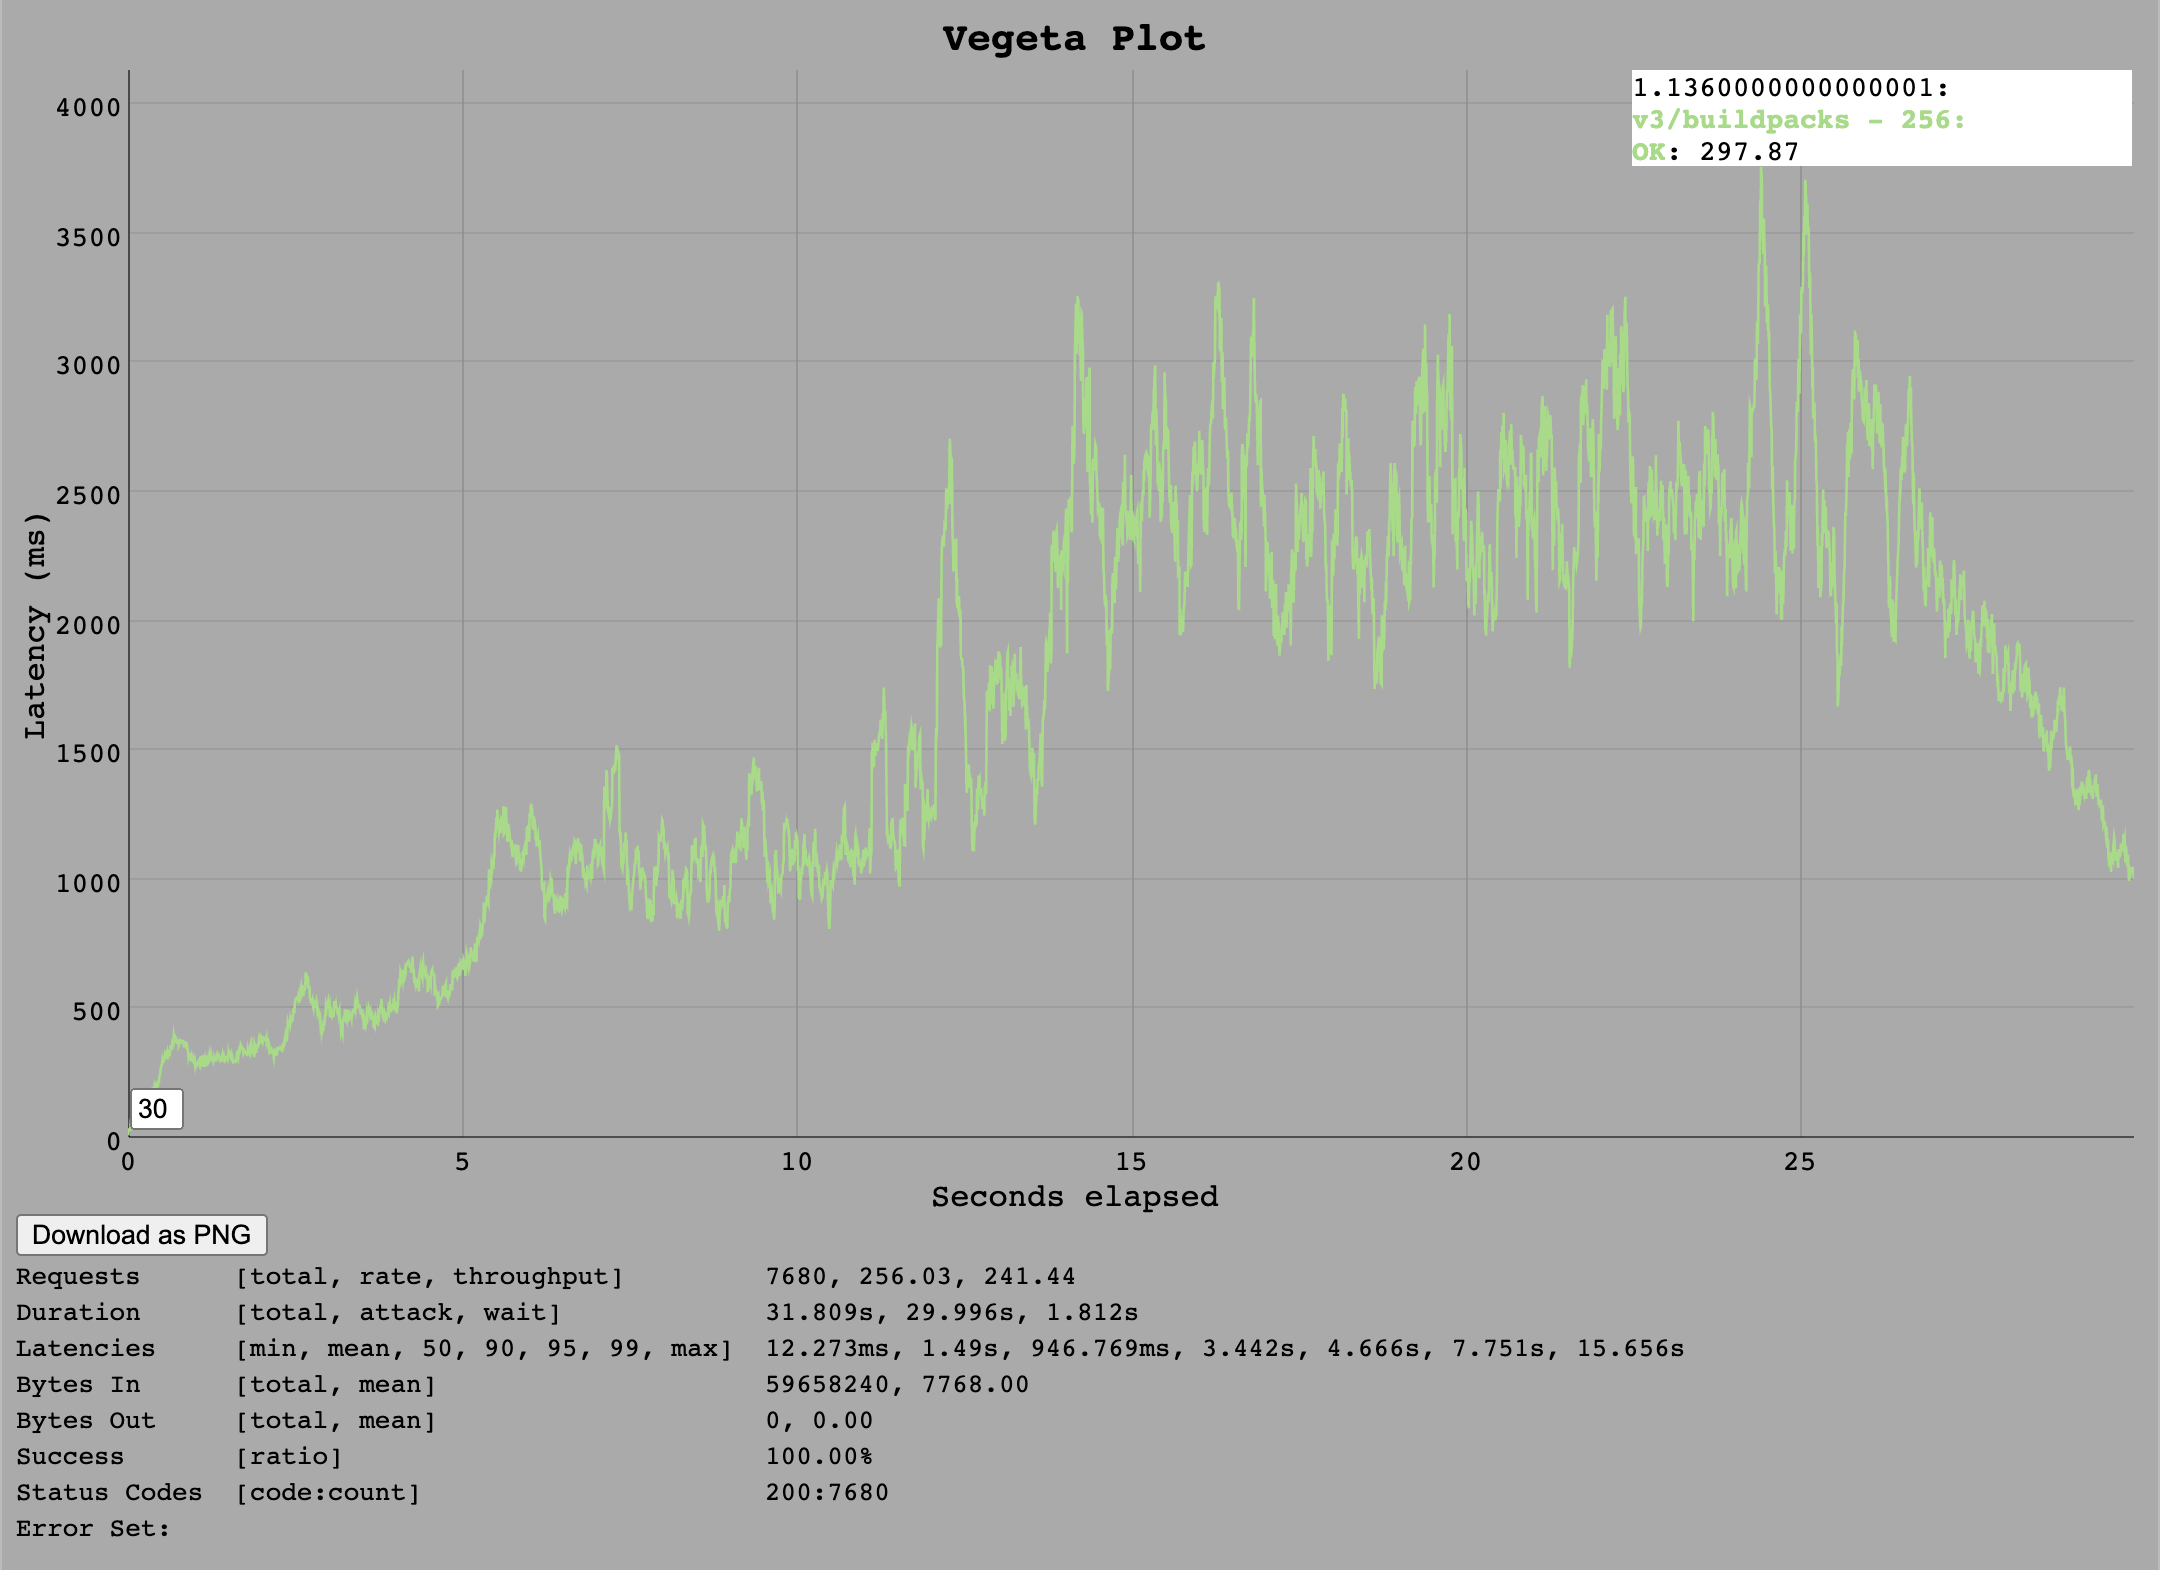
At 512 requests per second the Go implementation is overloaded in a way that API calls take longer and longer until eventually the 30 second timeout of test client cancels the request and marks it as error for the particularly slow requests (around 50%).
/v3/security_groups/:guid
The security_groups endpoint can now only handle around 320 requests per second which produce roughly 1k transactions per second on the database also.
This endpoint is thus a bit cheaper than v3/buildpacks since it issues fewer or cheaper database statements.
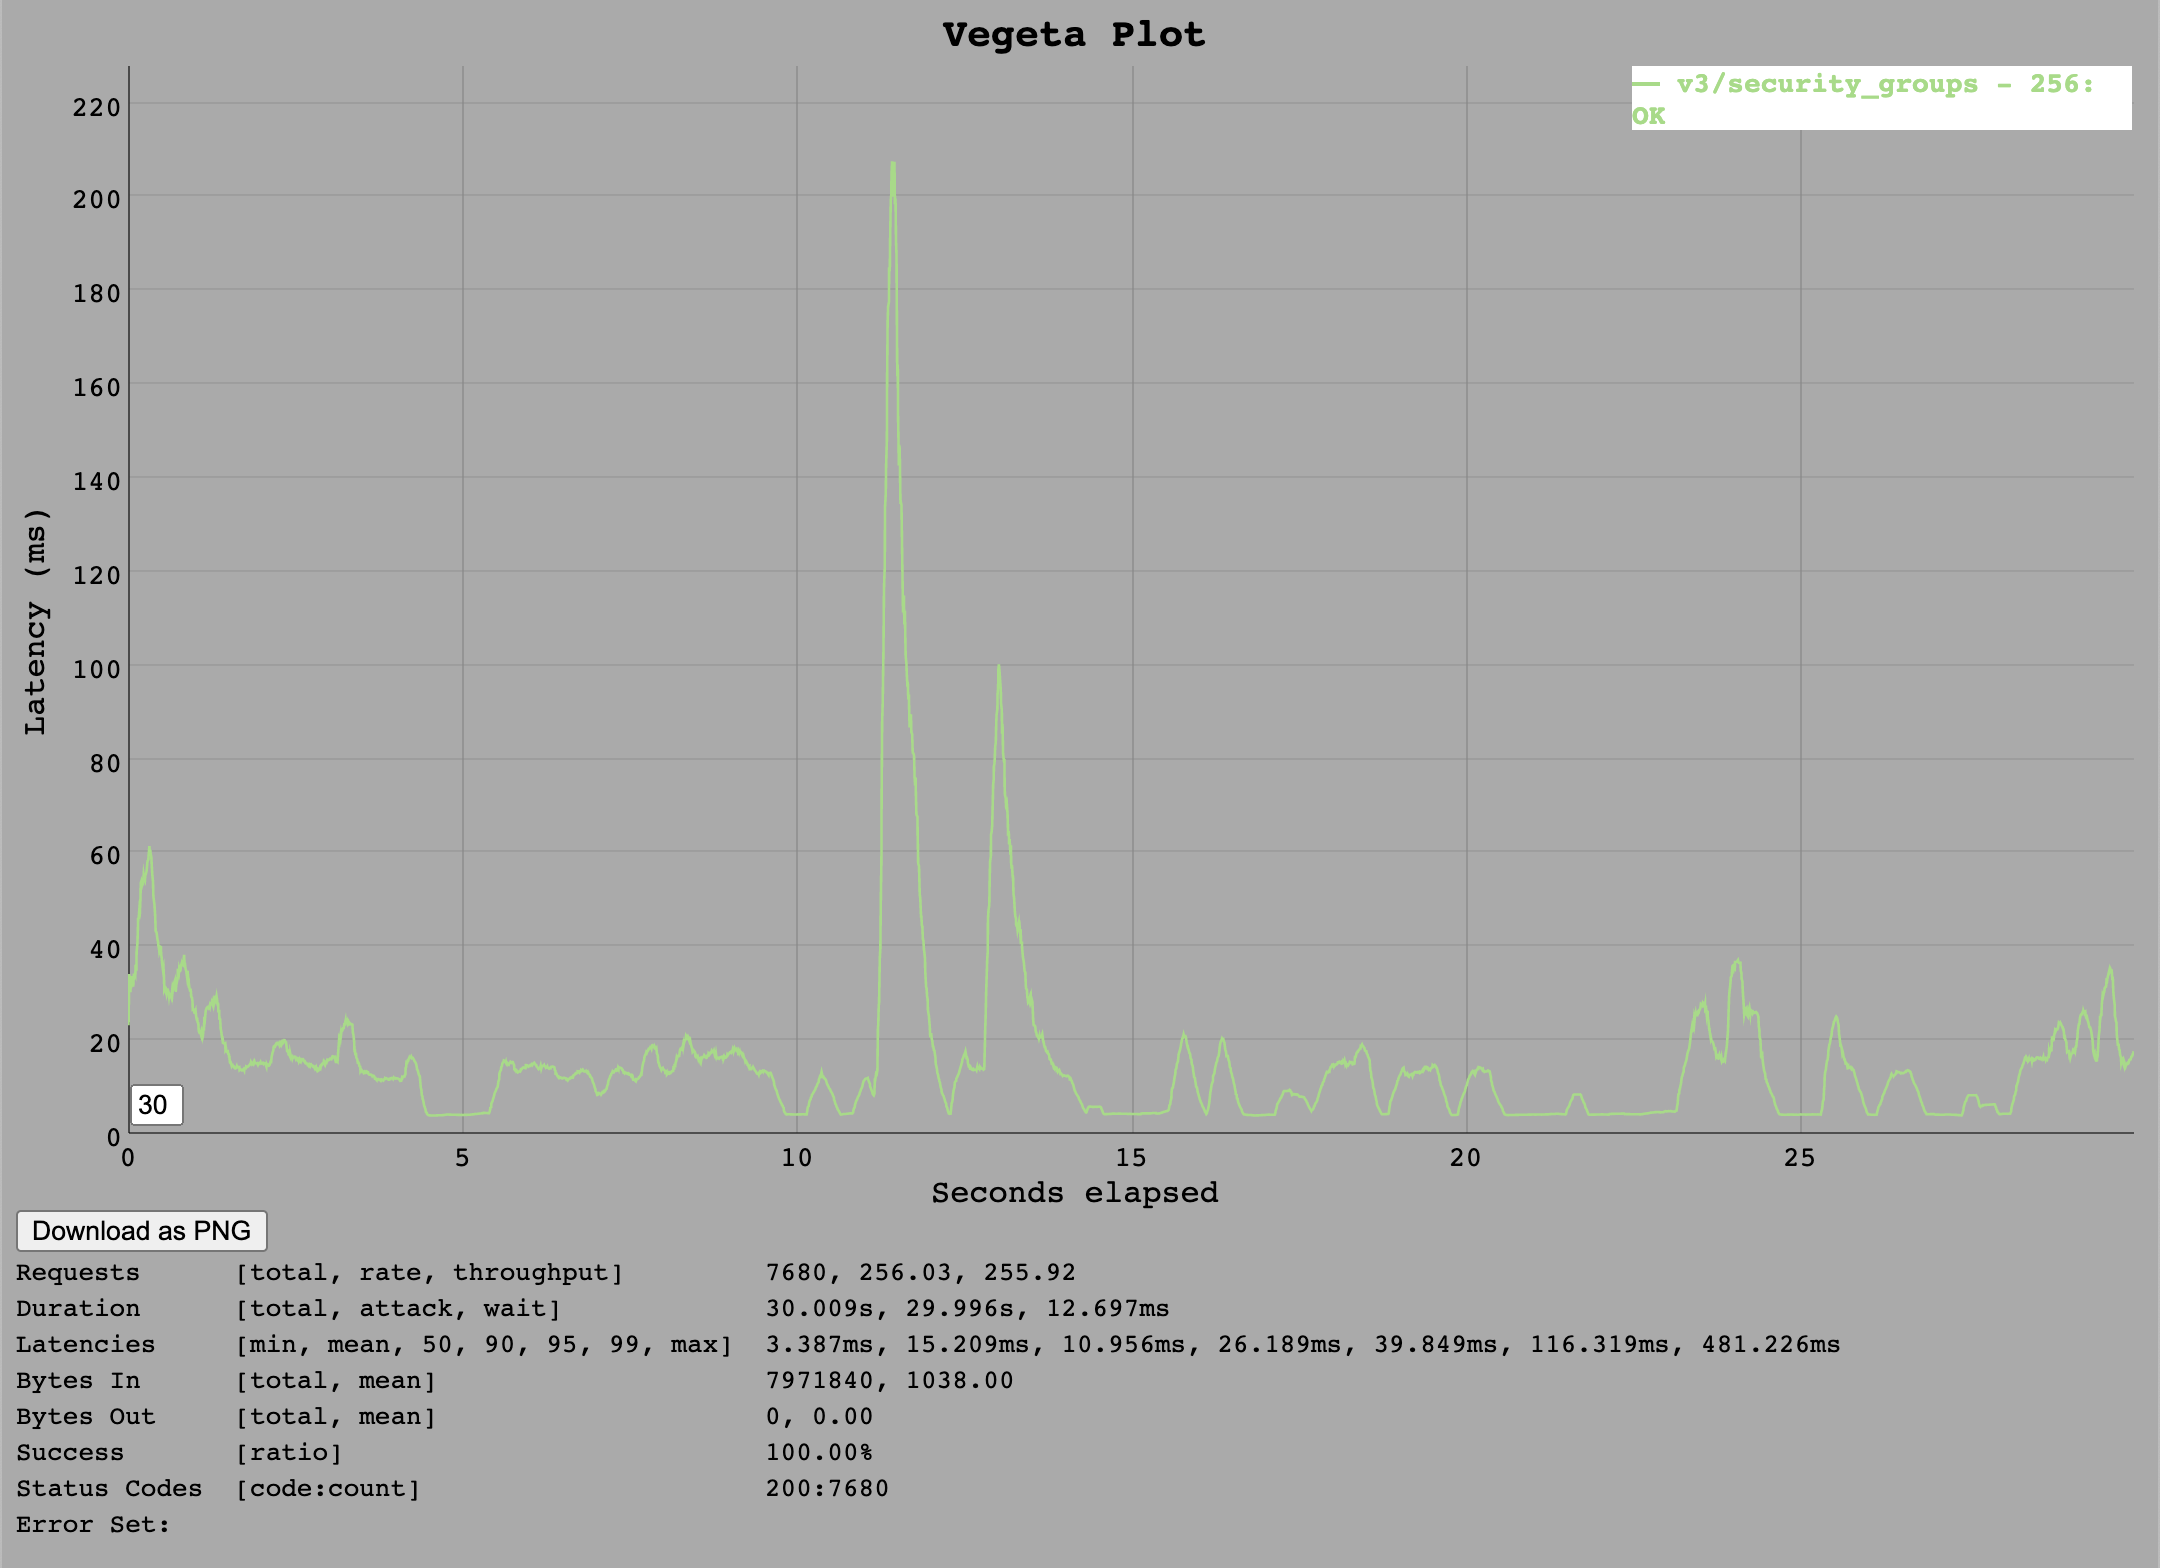
The test at 256 requests per second was successful.
 It struggled a bit with 512 requests per second, managing only around 320 requests per second.
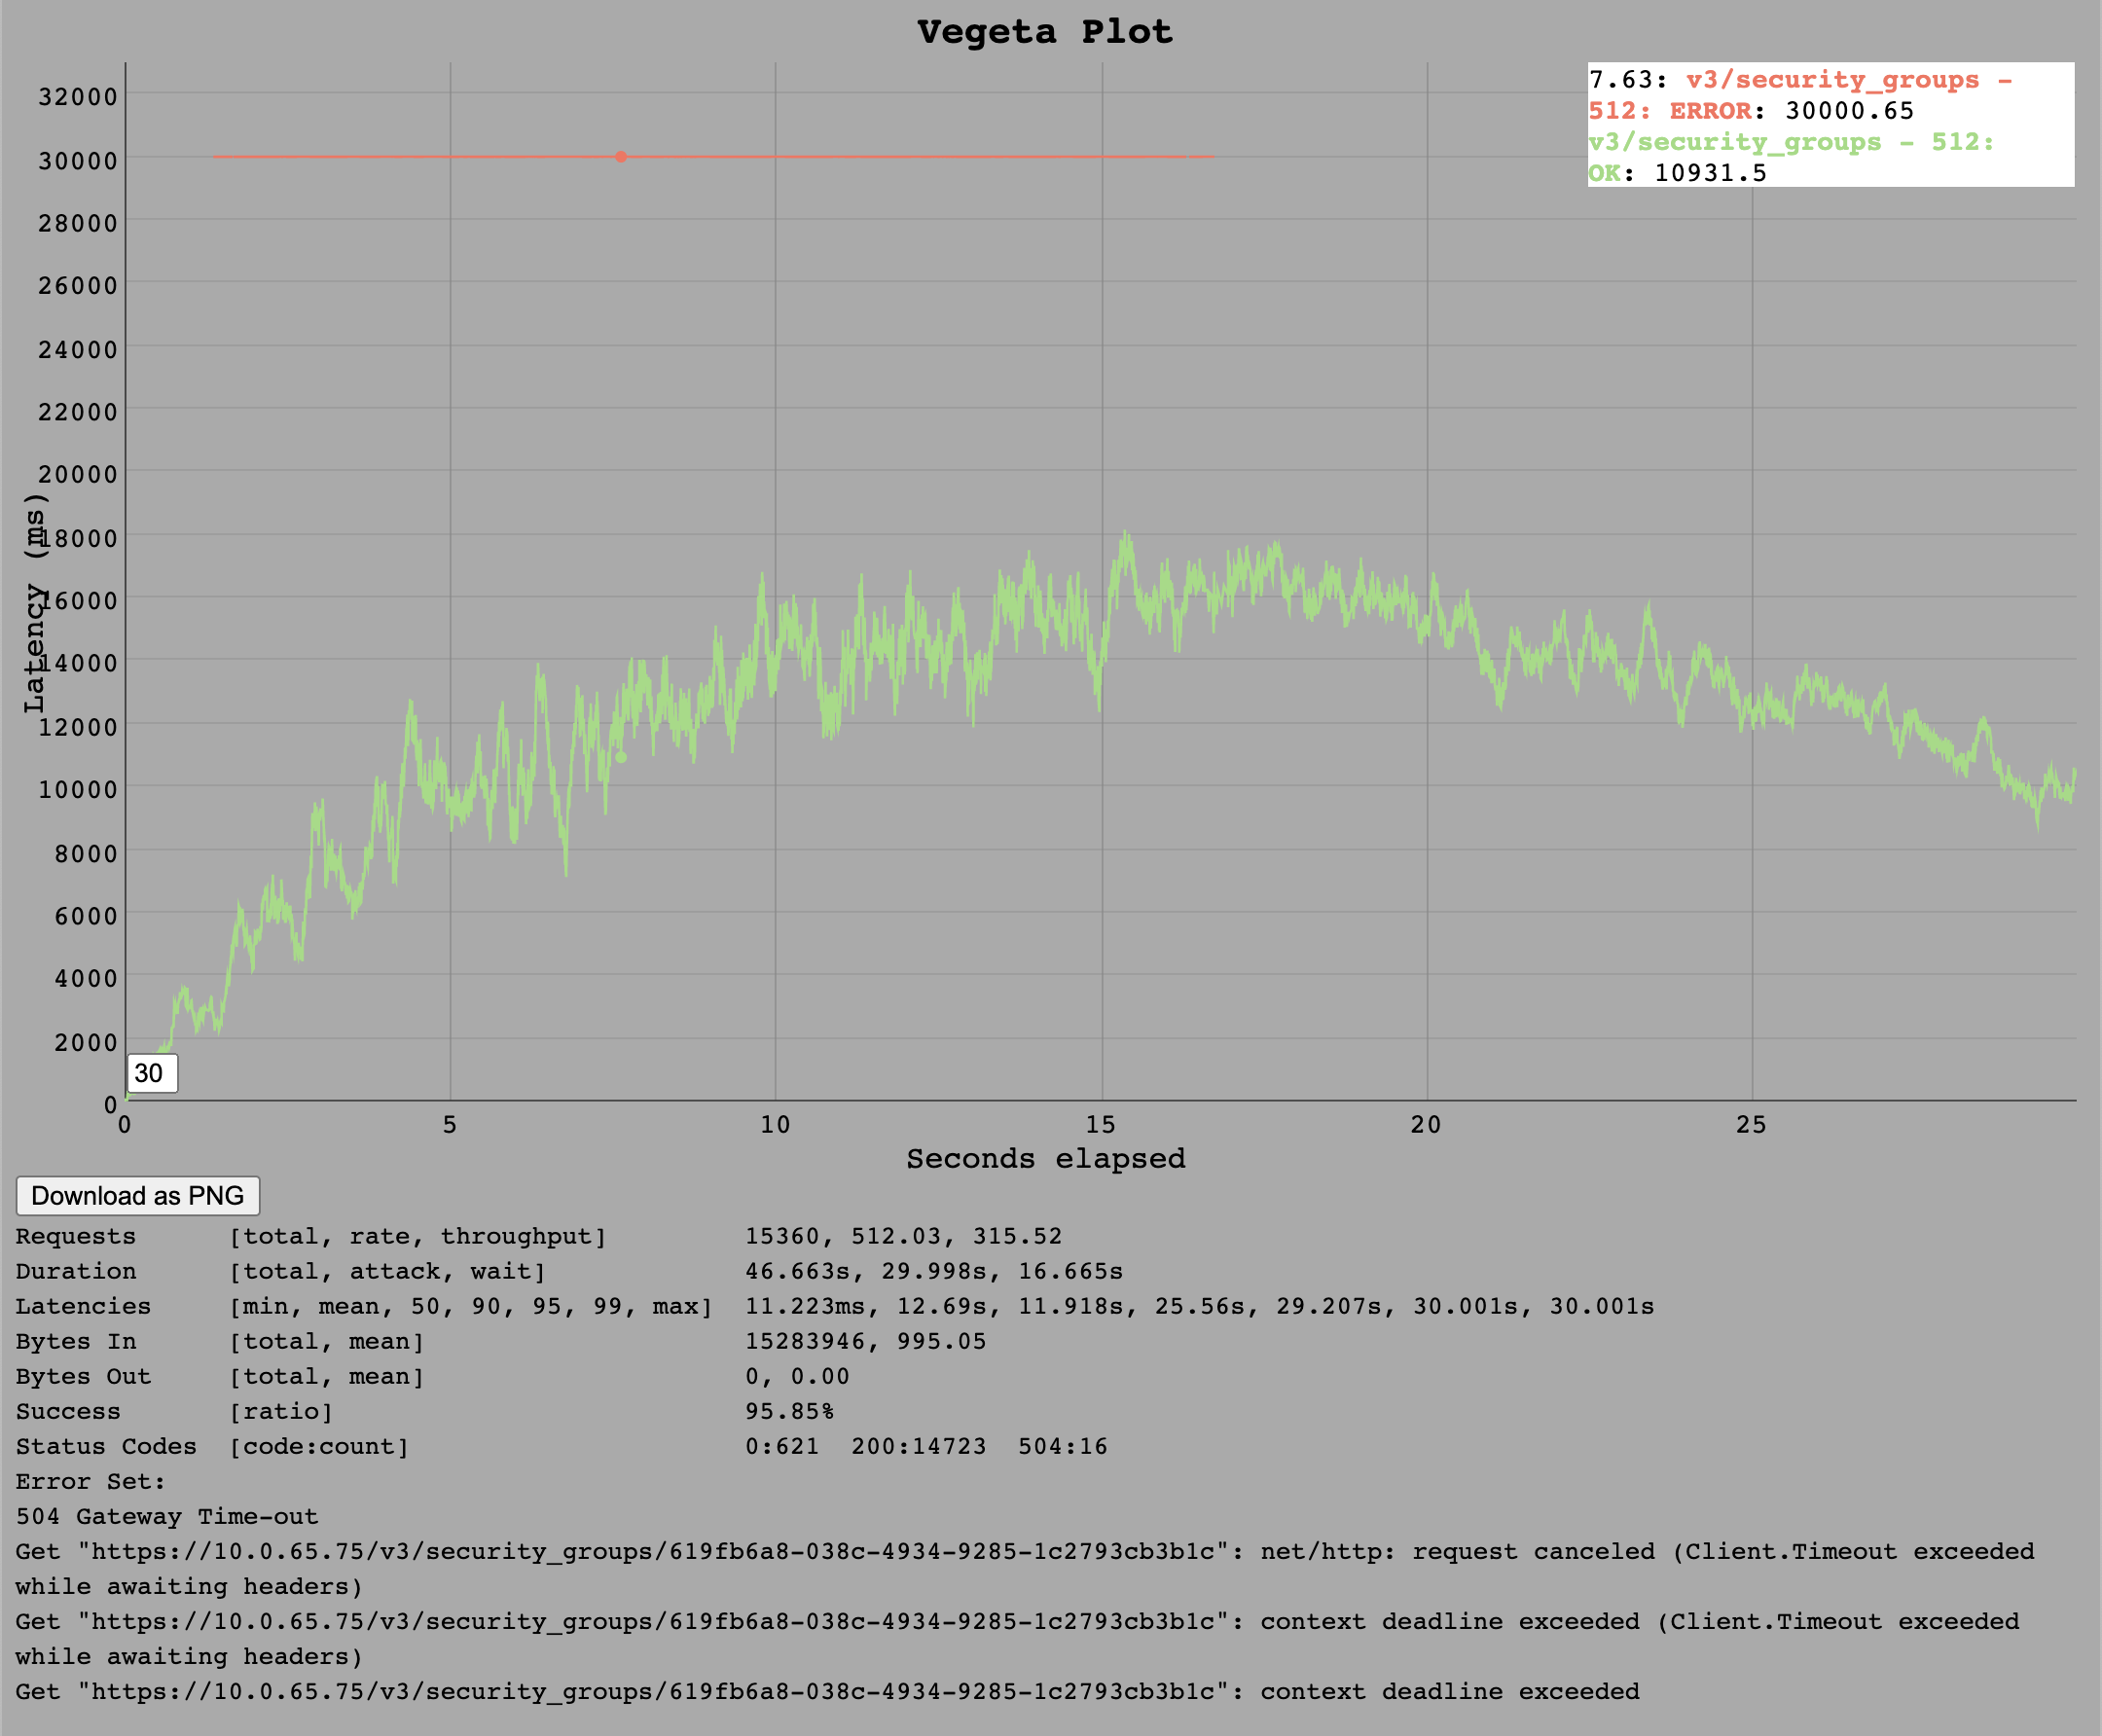 Since the 1k transactions per second seems to stay the same in comparison to the
 /v3/buildpacks endpoint, we expect this number to be a realistic limit for a single DB connection.
VM Resources
Metric values were essentially the same between this run and the one with unlimited DB connections. The exception being DB connections and transactions per second of course.
DB connections and transactions per second
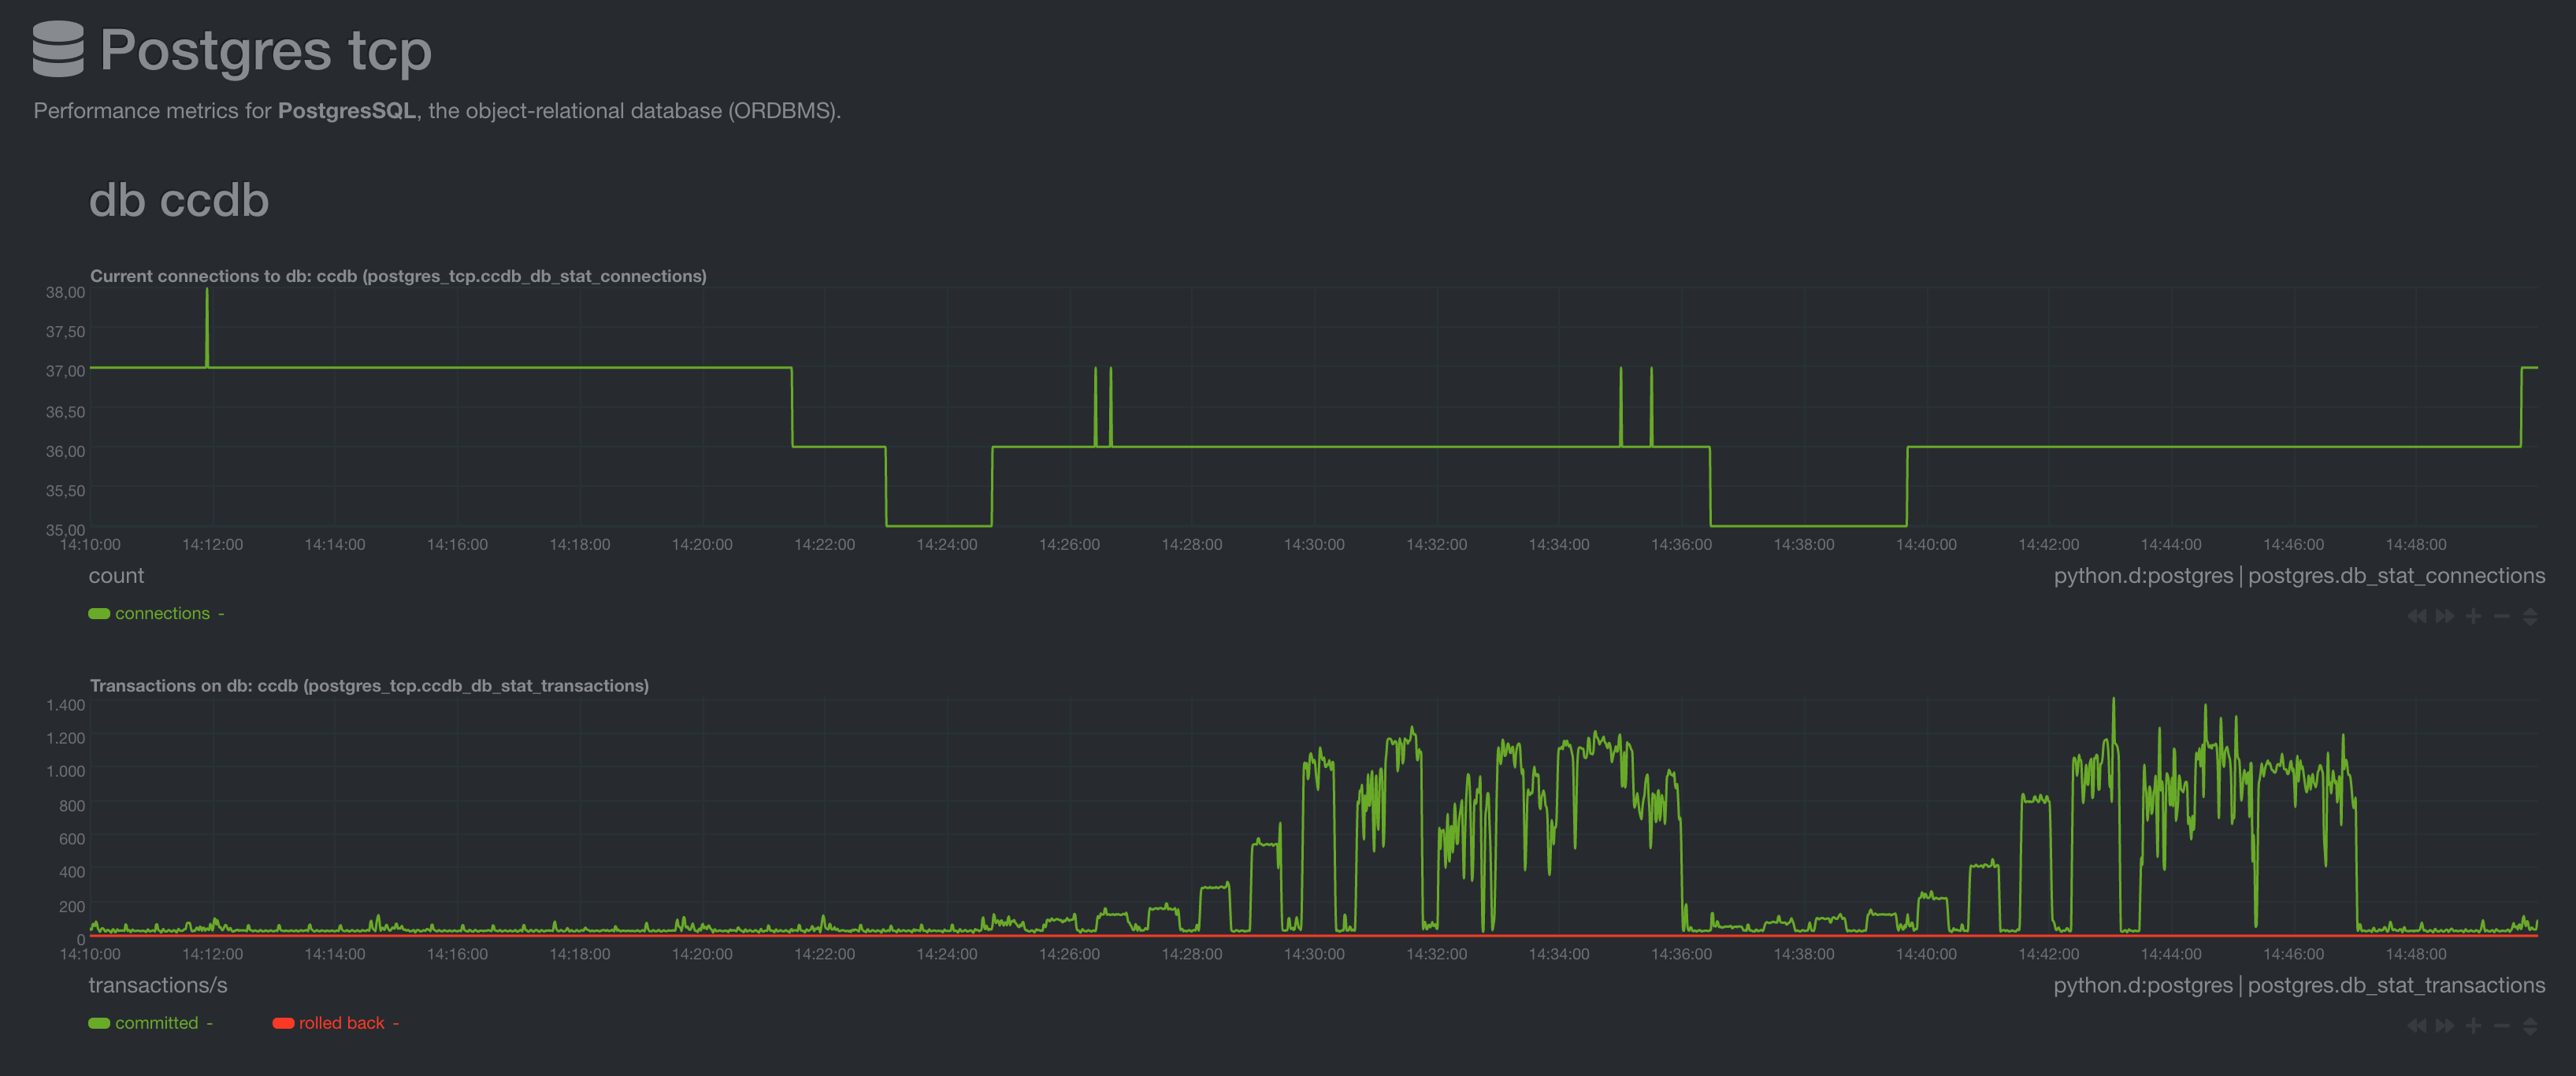 The DB connections show around 30 connections because another
 cloud_controller_ng instance is connected at the same time but without any load.
Summary
We estimate the Go implementation can serve around 1k transactions on a single DB connection when not being limited by CPU but instead the DB connection. As 1k DB transactions correlate to 320 /v3/security_groups/:guid calls and 250 /v3/buildpacks calls, it could theoretically handle 320req/s * 5000 connections = 1600000 so 1.6 million requests per second over 5k DB connections for /v3/security_groups/:guid. This probably won't actually be achievable since the DB could never handle this many transactions (1000 transactions per second * 5k connections = 5 million). However this does indicate that for the Go implementation, the number of DB connections should not be a limit anymore - rather the VM and DB performance.
Raw Measurements
All results can be found in below table.
Viewing Raw Results
The the raw measurements tarballs linked above include:
vegeta.logTerminal output as text file (#vegetalog)netdata.snapshotVM and database metrics during run as netdata snapshot (#netdata-snapshot)v3-.*_[0-9]*.binBinary vegeta files (#binary-vegeta-files)html folderPre-rendered analysis from the binary files (#html-folder)
Vegeta.log
A text file with (UTC) timestamps when the runs where executed. You can use these timestamps to correlate metrics from the netdata snapshot to individual runs.
Example:
...
Targeting: https://10.0.65.75/v3/info
2021-11-03 07:56:07.314080 - Using attack rate: 8 - {"body": "", "header": {"Authorization": "REDACTED"}, "method": "GET", "url": "https://10.0.65.75/v3/info"}
2021-11-03 07:56:57.638468 - Using attack rate: 16 - {"body": "", "header": {"Authorization": "REDACTED"}, "method": "GET", "url": "https://10.0.65.75/v3/info"}
2021-11-03 07:57:47.913230 - Using attack rate: 24 - {"body": "", "header": {"Authorization": "REDACTED"}, "method": "GET", "url": "https://10.0.65.75/v3/info"}
...
Netdata Snapshot
Netdata is a system monitoring tool one can start as a container locally.
You can then view the tool at http://localhost:9090.
It will monitor your local machine, but you can import a previously made recording.
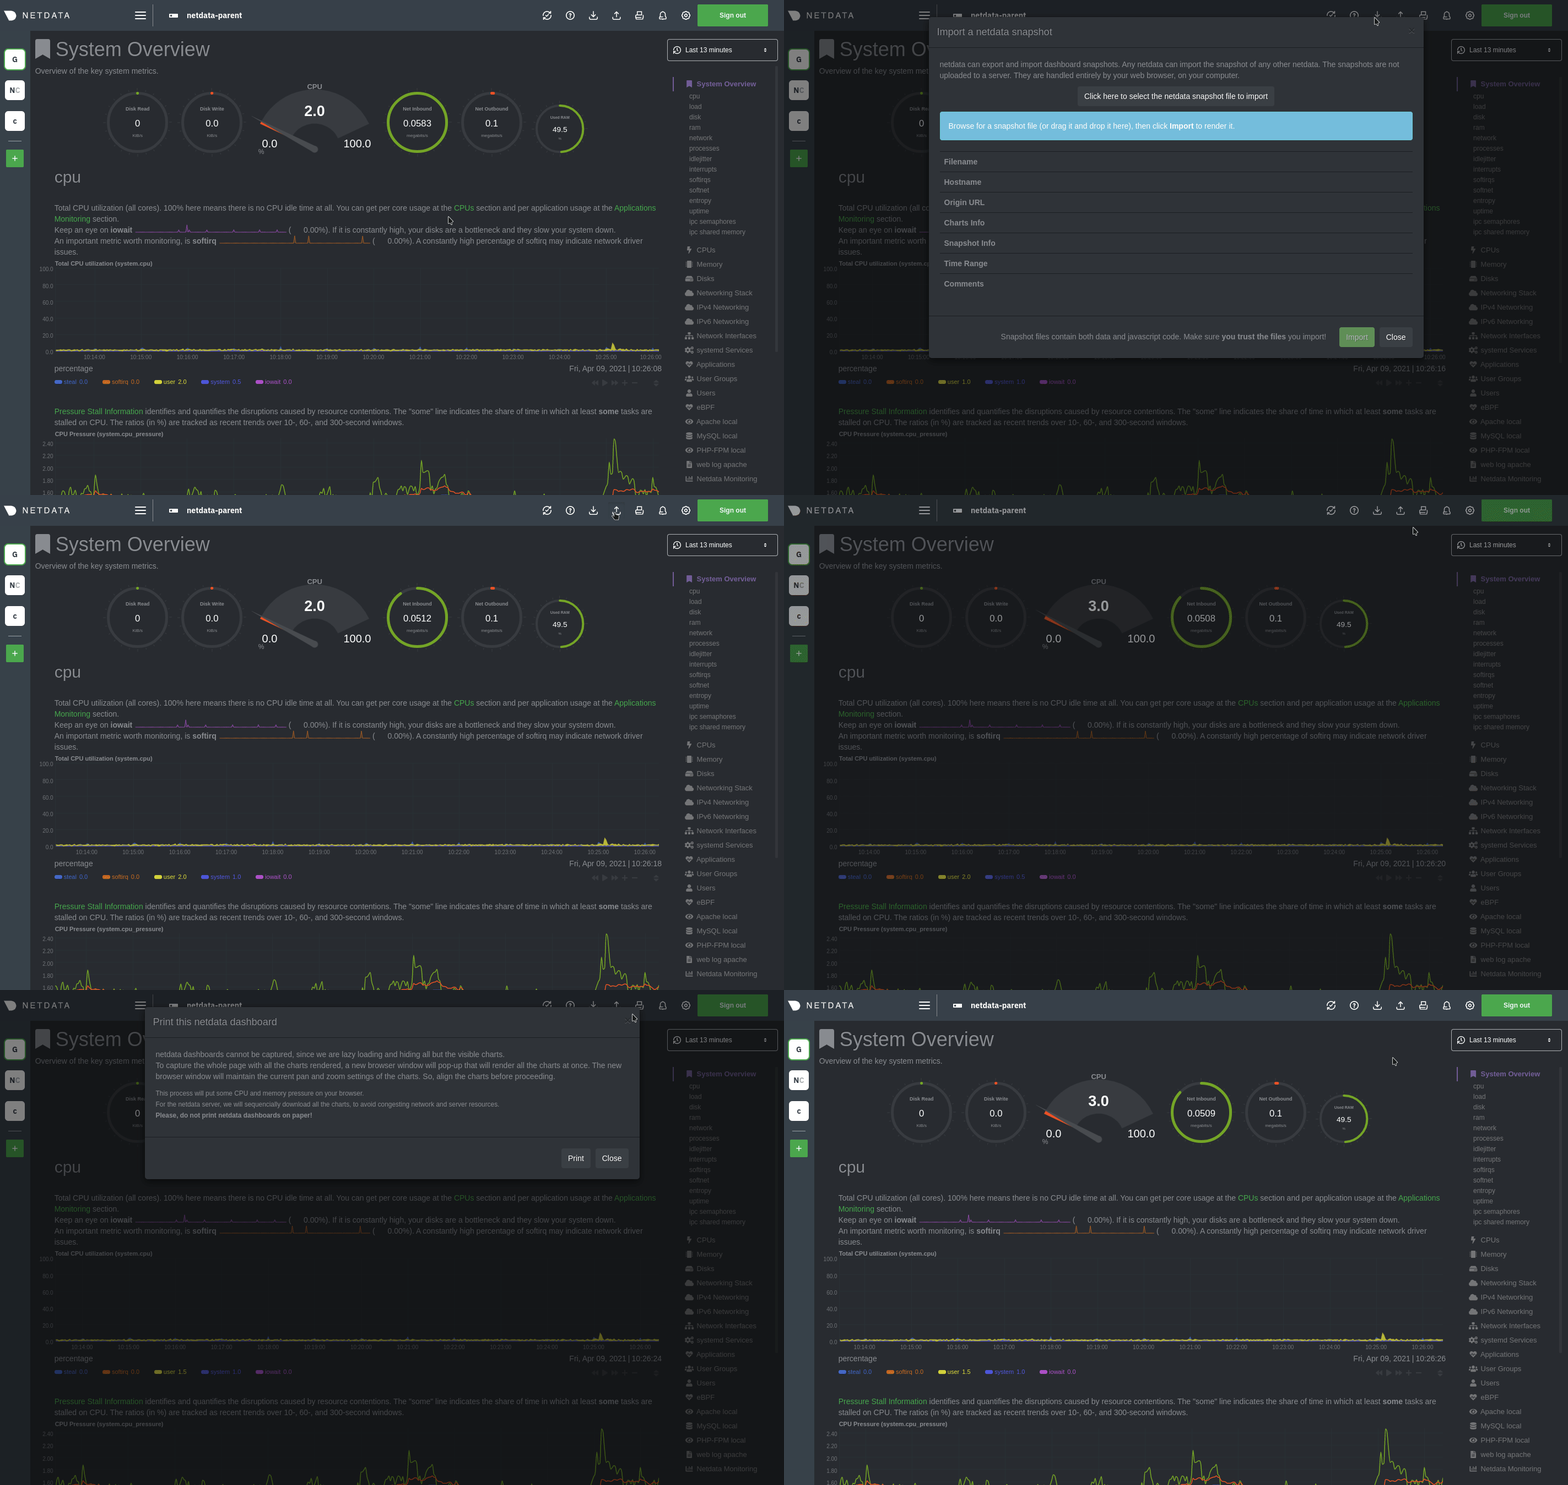 The file to use is
 netdata.snapshot inside the raw results archive.
Binary Vegeta Files
The results archive also includes raw binary dumps of vegeta.
The files have the .bin file ending. The name represents the tested endpoint as well as the load(requests per second).
E.g. v3-buildpacks_32.bin is a test of the /v3/buildpacks endpoint with 32 requests per second.
These files can be piped to vegeta for plotting and analysis. See: https://github.com/tsenart/vegeta#report-command
HTML Folder
The HTML folder includes the output of vegeta report as well as vegeta plot commands combined into one HTML page that can be viewed in your browser.